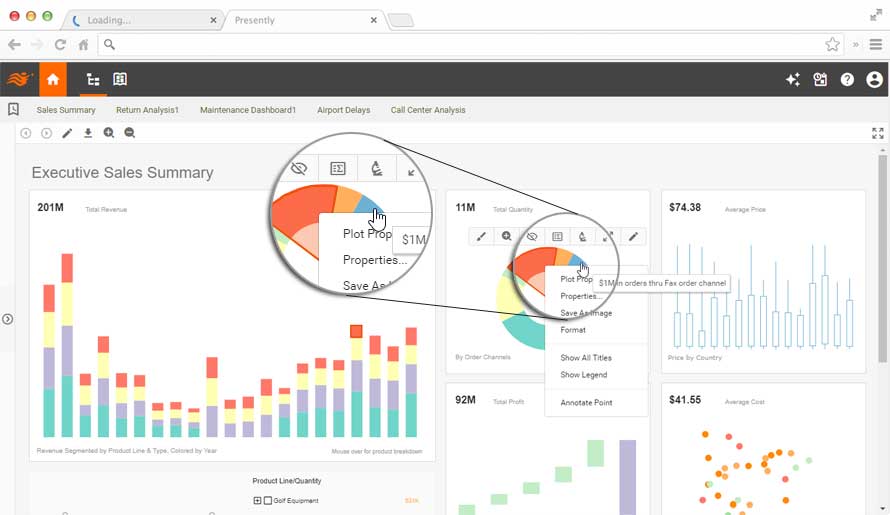
Self-Service Analytic Dashboards
Real-Time Monitoring Dashboards
Powered by a Data Mashup Engine

Award winning, trusted by 5,000+ customers since 1996
Risk Free Starter:
We create dashboards with your data (or mentor you to do so)
You use the dashboards/software for free (as a single user)
Business Users: Interactive Dashboards with Rich Customization and Self-Service
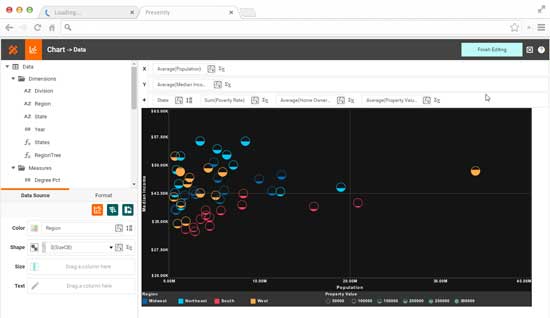
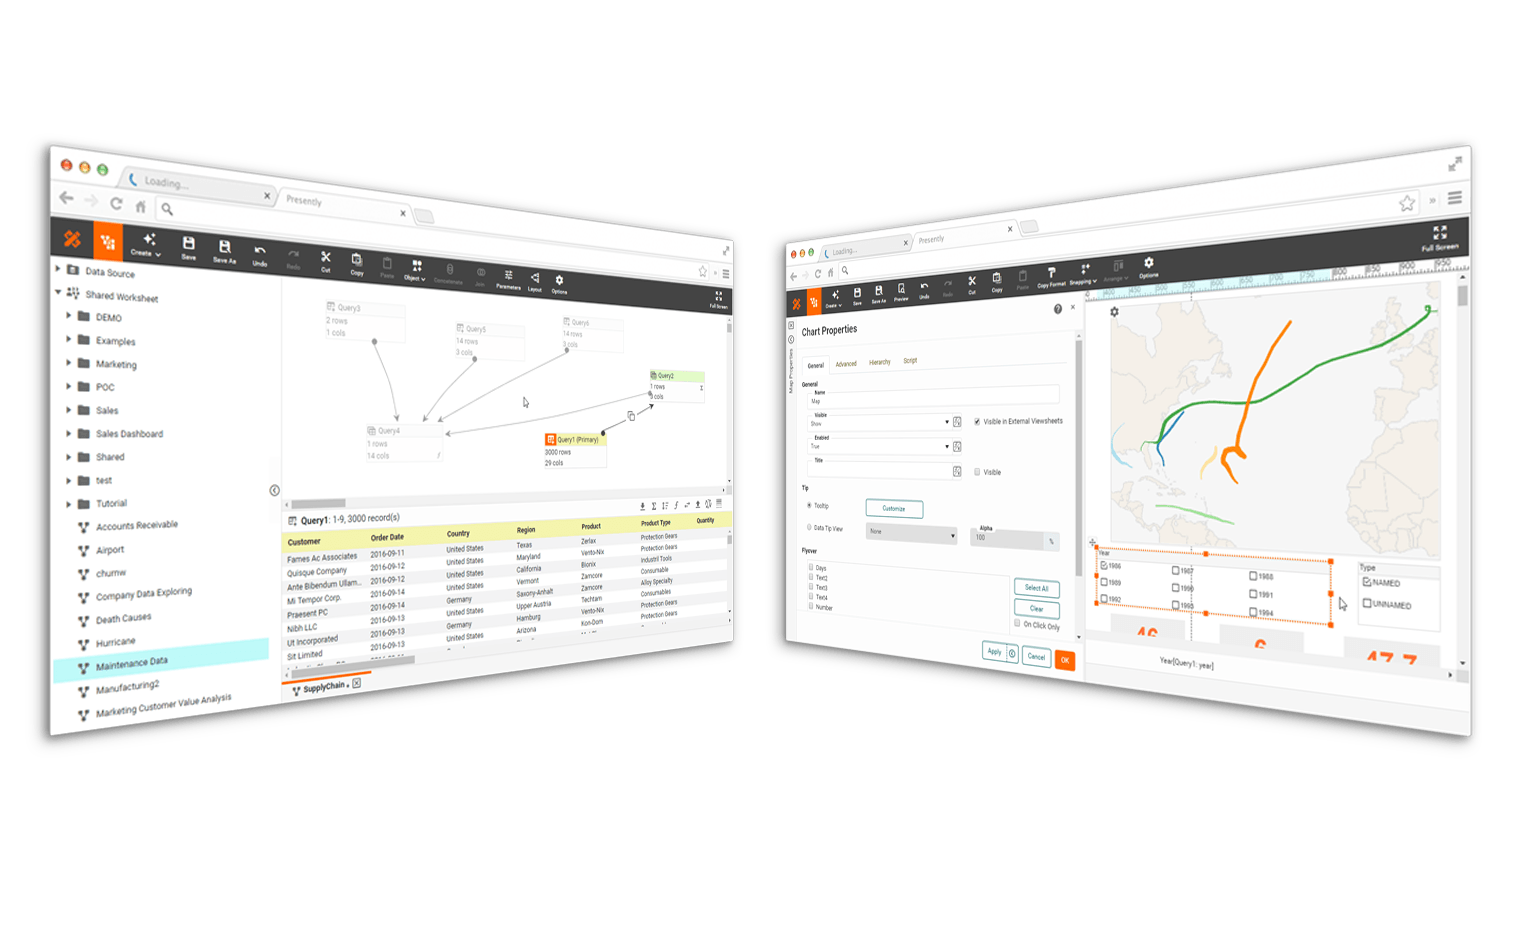
Designers: Rapidly Prepare Data and Design Dashboard Reports
Sample Customers


|


|


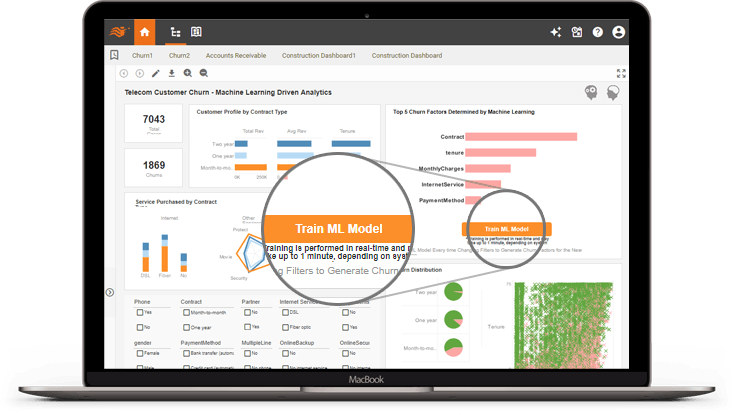
Data Specialists: Mashup Machine Learning with Business Intelligence
What KPIs and Metrics Does an Analyst for Occupational Health Services Track in Dashboards?
Occupational health services play a vital role in safeguarding the well-being of employees within organizations, focusing on preventing workplace injuries, promoting health and wellness, and ensuring compliance with occupational health and safety regulations. Analysts tasked with monitoring and improving occupational health services often rely on dashboards to track key performance indicators (KPIs) and metrics that provide insights into various aspects of occupational health management. In this article, we'll explore the KPIs and metrics commonly tracked by analysts in occupational health services dashboards, define their significance, and explain why they are useful.
1. Incident Rate:
Definition: The number of work-related incidents (such as injuries, illnesses, and near misses) per 100 or 1,000 employees within a specified time period.
Significance: Incident rate is a crucial metric for assessing the overall safety performance of an organization. A high incident rate may indicate inadequate safety measures, training deficiencies, or workplace hazards that need to be addressed. Tracking incident rates over time helps identify trends, prioritize interventions, and measure the effectiveness of injury prevention initiatives.
2. Lost Time Injury Frequency Rate (LTIFR):
Definition: The number of lost time injuries (those resulting in time away from work) per 1,000 hours worked by employees.
Significance: LTIFR provides insight into the severity of workplace injuries and their impact on productivity and employee well-being. By tracking LTIFR, analysts can assess the effectiveness of safety programs, identify high-risk areas or job tasks, and implement targeted interventions to reduce the frequency of lost time injuries.
3. Employee Absenteeism Rate:
Definition: The percentage of scheduled work hours missed by employees due to illness, injury, or other reasons.
Significance: Employee absenteeism can have significant implications for productivity, staffing levels, and organizational performance. By monitoring absenteeism rates, analysts can identify patterns, root causes, and trends, allowing for proactive management strategies to minimize disruptions and support employee health and well-being.
4. Compliance with Occupational Health and Safety Regulations:
Definition: The extent to which the organization adheres to relevant occupational health and safety laws, regulations, and standards.
Significance: Compliance with regulatory requirements is essential for mitigating legal risks, avoiding fines or penalties, and maintaining a safe work environment. Analysts track compliance metrics to ensure that policies, procedures, and practices align with regulatory expectations and to identify areas of non-compliance that require corrective action.
5. Health and Wellness Program Participation:
Definition: The percentage of employees participating in health promotion and wellness initiatives offered by the organization.
Significance: Health and wellness programs can improve employee morale, productivity, and overall well-being while reducing healthcare costs and absenteeism. By tracking program participation rates, analysts can assess the effectiveness of wellness initiatives, identify barriers to participation, and tailor programs to better meet the needs and preferences of employees.
6. Worksite Health and Safety Inspections:
Definition: The frequency and outcomes of scheduled inspections conducted to identify hazards, assess risks, and ensure compliance with safety regulations.
Significance: Regular worksite inspections are essential for identifying potential hazards and implementing control measures to prevent accidents and injuries. Analysts track inspection metrics to monitor the frequency of inspections, identify common safety deficiencies, and track the status of corrective actions to address identified hazards.
7. Return to Work Rate:
Definition: The percentage of employees who successfully return to work following a work-related injury or illness.
Significance: Facilitating timely and safe return-to-work processes is essential for minimizing the impact of injuries on employee well-being, productivity, and morale. Analysts track return-to-work rates to assess the effectiveness of injury management programs, identify barriers to return to work, and implement interventions to support employees during the recovery process.
8. Health Risk Assessment Results:
Definition: The outcomes of health risk assessments conducted to identify individual health risks, lifestyle behaviors, and chronic conditions among employees.
Significance: Health risk assessments provide valuable insights into the health status of the workforce and help identify areas for targeted intervention and health promotion. Analysts analyze assessment results to identify prevalent health risks, prioritize wellness initiatives, and measure the impact of interventions on reducing health risks and improving overall employee health outcomes.
9. Occupational Disease and Exposure Monitoring:
Definition: The monitoring of occupational exposures to hazardous substances, environmental pollutants, and physical agents to prevent occupational diseases and illnesses.
Significance: Occupational disease and exposure monitoring are essential for identifying workplace hazards, assessing risks, and implementing control measures to protect employee health. Analysts track exposure monitoring results to ensure compliance with exposure limits, identify emerging hazards, and assess the effectiveness of control measures in reducing occupational exposures.
10. Training and Education Compliance:
Definition: The extent to which employees complete required occupational health and safety training and education programs.
Significance: Comprehensive training and education are essential for equipping employees with the knowledge and skills needed to work safely and prevent injuries and illnesses. Analysts track training compliance metrics to ensure that employees receive essential safety training, identify training gaps, and measure the effectiveness of training programs in improving safety knowledge and behaviors.
Why These KPIs and Metrics Are Useful:
-
Performance Monitoring: KPIs and metrics provide objective measures of performance, allowing analysts to assess the effectiveness of occupational health programs, identify areas for improvement, and track progress over time.
-
Risk Identification: By tracking leading indicators such as incident rates, absenteeism, and compliance metrics, analysts can identify emerging risks, prioritize interventions, and prevent workplace injuries and illnesses before they occur.
-
Decision Support: Data-driven insights provided by KPIs and metrics enable informed decision-making, resource allocation, and strategic planning to optimize occupational health services and achieve organizational objectives.
-
Benchmarking: Comparing performance against industry benchmarks and best practices helps organizations identify opportunities for improvement, learn from top performers, and drive continuous advancement in occupational health and safety.
-
Communication and Transparency: Dashboards displaying KPIs and metrics facilitate communication and transparency across the organization, enabling stakeholders to access timely, relevant information and collaborate on initiatives to promote employee health, safety, and well-being.