Learning about Key Performance Indicators?
Key Performance Indicators, or KPIs, are business metrics that are used to track an organization's performance. Any industry, government agency, or non-profit organization needs to measure its performance on a daily, monthly or quarterly basis, and key performance indicators are those statistics that are deemed important to track in order to meet business goals or organizational objectives.
InetSoft is a business intelligence software provider who makes dashboard and reporting software that is most often used to track business performance, comparing actuals to forecast or target. In general no software application is going to provide KPI's ready-to-use, since KPI's are metrics that are often derived from formulae that are specific to an enterprise in many cases, and in all cases the data that make up the KPI need to be mapped into the software application.
However, InetSoft's application, Style Intelligence, is designed to be as easy as possible to deploy and use.

Examples of KPI's
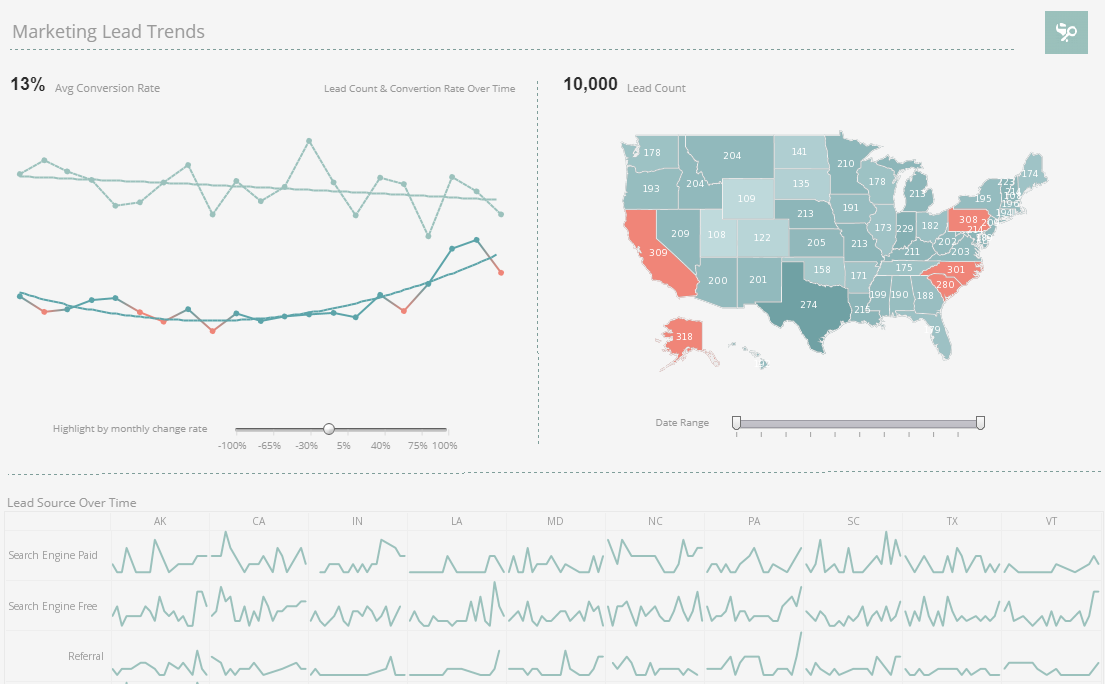
To visualize how some common KPI's can be charted and analyzed in InetSoft's application look at the example screenshots below. This KPI example come from InetSoft's dashboard and reporting solution for salesforce.com, and can easily be built with InetSoft's on-premise business intelligence software application, Style Intelligence.
The Marketing Department of any products or services company needs to track leads as one of its KPIs. This screenshot shows the weekly count of the number of new leads generated. In addition, thanks to multi-dimensional charting of the source of leads by colors in the vertical bars, the reasons for a KPI's increase or decrease can be seen. The checkboxes to the right provide simple point-and-click access to filtering to explore further the reasons for change, or for slicing and dicing different campaigns, so that multiple KPIs can be tracked in a single "report."
More Departmental KPI's
Other marketing KPIs that could be tracked are churn, conversion rates, customer value, customer profitability, CPL, CPA, and CPGA.
Common sales KPIs that are tracked are time to close, win rates, average deal size, sales actuals vs forecast, and quota attainment percentage.
Supply chain KPIs include turnover, efficiency, out-of-stock performance, shrinkage rates, number of weeks of supply, and average order lead time.
Popular HR KPIs include average number of training hours per employee, staff turnover, average training costs per employee, and HR FTE to total FTE ratio.
No function has more KPIs than Finance, and examples include cost of goods sold (COGS), operating margin, net change in cash, revenue per employee, earnings before interest and taxes (EBIT), debtor days, and forecast accuracy of budget.
KPIs in Information Technology could be % of systems with latest anti virus/antispyware signatures, system availability or uptime, mean time to repair (MTTR), first-call resolution rate, and % of unplanned outage/unavailability due to changes.
In Customer Service, key metrics include % of email inquiries responded within 24 hours, Customer Complaint Ratio, average response time, customer satisfaction, and percentage of complaints escalated to top management
Hear InetSoft Customer KPI Success:
"We selected InetSoft's Style Report Professional for a time-tested, dependable publishing engine and a powerful, yet easy-to-use report designer that would save resources associated with internal development of publishing capabilities and client customization requests. We were looking for a Java-based publishing solution that could be easily integrated with our own. We have been pleased with deployment, and the reporting software's part in our ability to help companies of all sizes realize cost reduction and revenue acceleration associated with critical configuration and accurate quoting solutions." - Craig Christiansen, President-Technology at FPX
Industry-Specific Key Measures
Accommodation & Food: ratio of national to international guests, spend per head, average number of guests per employee, percentage of rooms with maintenance issues, percentage of cancelled reservation requests, and gross operating profits per available room.
Agriculture & Forestry: sow mortality %, piglet survival %, average milk yield per lactation, average milk yield per cow, water-to-milk ratio, energy-to-milk ratio, deforestation rate, and percentage of forest areas under protected status.
Banking & Insurance: average sum deposited in new deposit accounts, Loss Ratio (%), claims solvency (%), percentage of overdue claims, Tier 1 capital, management fees as % of fund size, % of lending to micro, small and medium size businesses, and percentage of operating revenue from banking fees.
Construction & Engineering: percentage of construction and demolition waste recycled, square meter price, Actual construction hours vs Planned construction hours, work intensity, Cost per km, and time to rectify defects in maintenance period.
Education & Research: % of courses that are web-based or web enhanced, student / teacher ratio, class attendance %, dropout rate, Flesch Reading Ease, Flesch–Kincaid Grade Level, graduate employment rate, and graduation rate.
Emergency, Police & Justice: average time to respond to emergency, number deliberate fires (including vehicles) per 10,000 population, percentage of prank calls, false alarms by automatic fire detections per 1,000 non-domestic properties, resolution rate of criminal offenses, percentage of positive stop and searches, and % of police officers not making shooting qualifications.
Categorization of Key Performance Indicators
Key performance indicators define a set of values used to measure against. These raw sets of values, which are fed to systems in charge of summarizing the information, are called indicators. Indicators identifiable as possible candidates for KPIs can be summarized into the following sub-categories:
- Quantitative indicators which can be presented as a number.
- Practical indicators that interface with existing company processes.
- Directional indicators specifying whether an organization is getting better or not.
- Actionable indicators are sufficiently in an organization's control to effect change.
- Financial indicators used in performance measurement and when looking at an operating index.
Key performance indicators, in practical terms and for strategic development, are targeted objectives that will add the most value to the business. These are also referred to as key success indicators.
Machine Learning(ML) and Key Metrics
Traitionally, key metrics are defined out of business experience by humans. Data based key metrics definition has become feasible with advances in Machine learning. For example, it might not be apparent what key factors are affecting employee turnover. Traditionally human defined key metrics such as job satisfaction surveys and compensation parity alone are not sufficient to explain retention performance. Machine learning can use data to find addtional key metrics that HR should analyze and monitor.