-
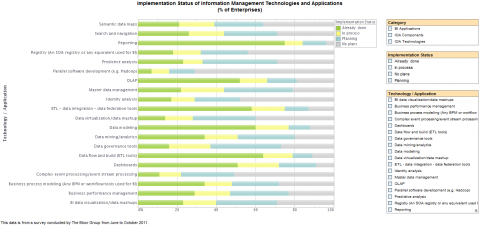
Interactive Chart for the Enterprise BI Survey Report
Read moreWe created a handy interactive chart for three of the questions in the Enterprise BI Survey Report that we...
December 22, 20113 -

InetSoft Included in Gartner’s Who’s Who in Interactive Visualization for Analysis and Dashboarding
Read moreInetSoft was mentioned in Gartner Who’s Who in Interactive Visualization for Analysis and Dashboarding. Access to the entire report...
-

Interesting Discussion on Visual Data Analysis
Read moreSometimes you come across data visualizations that are so richly beautiful, that you can easily imagine them hanging from...
-
Why Do I Need Visual Analysis Tools?
Read moreMany organizations question the need for visual analysis. They note the abundance of data at their disposal in...
