Many organizations question the need for visual analysis. They note the abundance of data at their disposal in the form of spreadsheets that track a variety of metrics throughout the organization.
To those organizations we merely ask this: Have you ever felt like you were drowning in a sea of spreadsheets?
Spreadsheets are an unstoppable force that can sweep through an organization via email and shared drives leaving chaos and confusion in their wake. They are prone to human error, lack sufficient security measures, and can be unnecessarily complex and difficult to understand.
Spreadsheets are a Danger
If you rely on spreadsheets to measure key performance indicators and guide internal processes and market-place activity, take note of the following Academic Study:
168 first- second-year undergraduate students were given the Wall task developed by Panko. In the first task, they build the model. In a second task, given days later, they performed a what-if analysis. In the first task, they made errors in 42% of the spreadsheet and had a cell error rate of 2.05%. Of the errors, 27% were mechanical errors, 27% were logic errors, and 47% were omission errors.
In the second task, 50% of the spreadsheets had errors, and the cell error rate was 3.05%. While doing the second exercise, the subjects corrected 29 of their 86 errors but made 71 new errors. Mechanical errors had a higher correction rate than logic or omission errors, but the numbers were too small for statistical testing. Among the new errors, 72% were omission errors.
– Teo, T.S.H. & Tan, M., “Quantitative and Qualitative Errors in Spreadsheet Development,” Proceedings of the Thirtieth Hawaii International Conference on System Sciences, Kihei, Hawaii, January 1997.
Clearly information entered into spreadsheets is prone to human error. And it’s not too big a leap in logic to believe that errors can accumulate overtime and continue to snowball into larger errors that can affect businesses’ bottom line.
Data is an organization’s most valuable resource and great effort should be made to protect it. But, this doesn’t mean that access to data should in any way be limited. Information still needs to be shared both laterally and vertically to create one accurate picture that will help to chart future movement.
How can InetSoft Help?
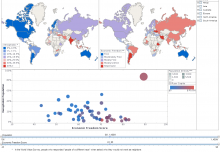
InetSoft’s data visualization solution simultaneously reduces the capacity for human error by providing report security while allowing designated users to dissect multidimensional data in an apprehensible visual format. Since data remains in its original unadulterated form, organizations are assured that the decisions and actions they take are based on sound information.