StyleBI
Visualization Dashboards
with Boundaryless Self-Service
Analytics
Quick, Iterative Data Mashup, and Visualization Design - in a Single Web App
Having data mashup and visualization design tightly coupled in a single web application allows a natural, iterative development process. This high productivity is not limited to design professionals. Since a user portal is also integrated in the web app, business users can easily engage with professional designers in the design process to minimize business and technology gaps.
A pure web app approach naturally makes the application ideal for in-cloud platforms. The data mashup engine's cache and acceleration power further ensure high performance regardless of deployment choices.
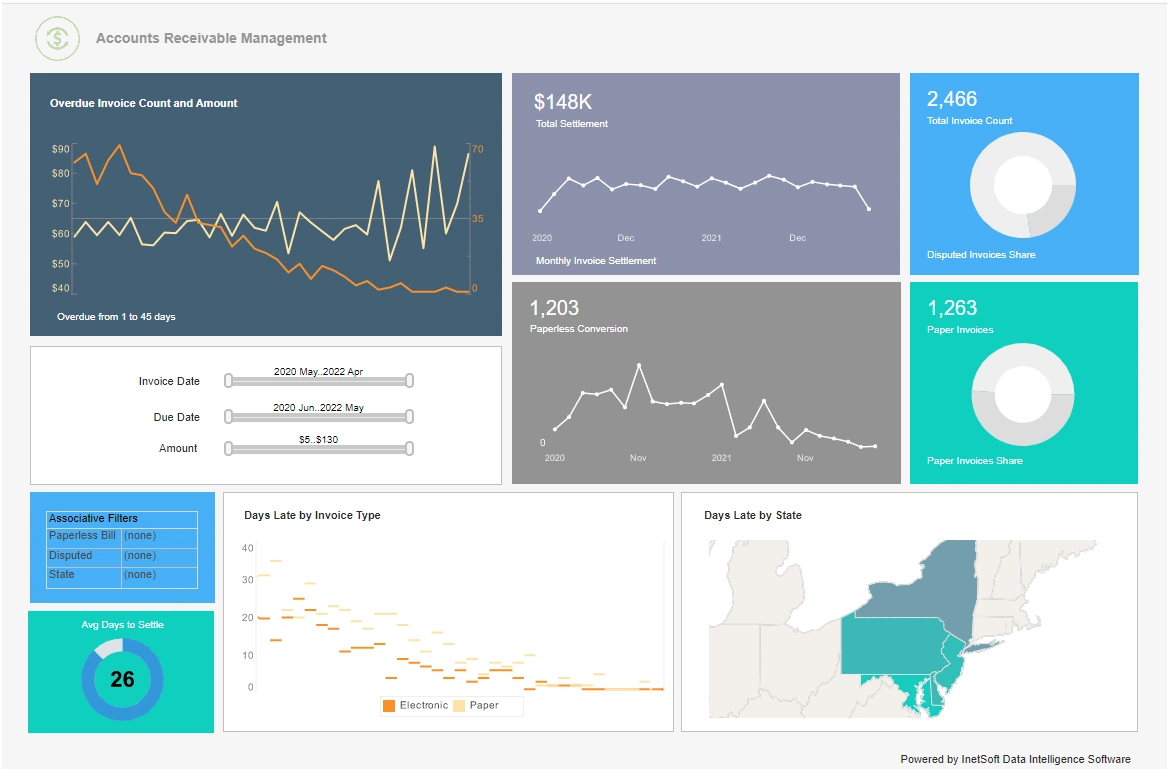
Flexible Charts and Tables, Rich Visual Components
Charts are the easiest to understand visualization tool, and InetSoft offers many choices.
Tables, as spreadsheets have demonstrated, can pack information in their special ways. InetSoft offers extremely flexible tables that can embed sophisticated inter-cell calculations.
Beyond charts and tables, many other familiar user interface components are equally useful in a dashboard setting. InetSoft treats all these components as first class citizens. That gives each component extensive functionality of its own.
A Versatile, Responsive 100% Web-based App That Adapts to All Devices
Unlike many competitive options, the InetSoft application is 100% web-based and delivers maximum self-service to designers, who have full control on how their visual dashboards will behave on different devices. This responsive design makes a separate mobile app unnecessary.
Even on small real estate devices like phones, visual dashboards still retain their full interactivity.
Maximum Self-Service Analytics
Professionally designed visualization dashboards typically covers all important KPIs. When a KPI needs attention, self-service analytic ability becomes critical. Moreover, there will always be ad hoc and new business questions regardless how well pre-desigend dashboards' coverage. InetSoft's visualization dashboard Web app is specifically designed to maximize business user self-service.
Technical users find the designer powerful enough to create advanced data transformations and mashups without writing SQL, power users can easily create new dashboards and perform ad hoc chart editing, and business users personalize their analytical views saving them as bookmarks.
Embeddable and OEM-Friendly
The InetSoft application is expressly designed to be embedded, whether inside an enterprise portal or another solution provider's cloud-based solution. OEM-friendly features include multi-tenant hosting, full white-labeling, and flexible licensing models to match the partner's.
Highly Rated By Customers and Award Winning
Great Product. Responsive Support and Training.
Flexible product with great training and support. The product has been very useful for quickly creating
reports and data views. Support and training has always been available to us and quick to respond.
- George from Sonepar USA