The world is moving at a rapid pace and businesses that are not in-line with the times are going to fall way behind in the competition. Previously, companies were only focused on delivering services and products to a limited geographical area; however, today they have the world as their marketplace because of advancements in technology. This has resulted in increased data to read and analyze in order to maximize performance. Thus, irrespective of the size of the organization, it has become imperative for companies to rely on business intelligence (BI) for data analysis. Today, businesses need useful information including key performance indicator tracking (KPIs), trending analysis, and predictive modeling to name a few analytical activities that must be performed from this data in order to create short and long-term strategies that will help them remain a step ahead of their business rivals.
Business Intelligence Tools or Business Intelligence Dashboards
The rising need for implementing BI presents new challenges; they need to make a choice whether they want to adopt a business intelligence tool or a business intelligence dashboard. Let’s first try and understand the two methodologies.
Business Intelligence Tools
Business intelligence tools are software applications designed to help companies retrieve and analyze data stored in their database or data warehouse. These tools let companies refine critical data into information and further filter and aggregate this information into digestible portions that help them understand the facts and make appropriate business decisions.
Business Intelligence Dashboards
Unlike BI tools where the data had to be first stored in the database before corporations can analyze it to make a decision, BI dashboards are designed to provide critical business information in real-time. These BI dashboards can be seen as the dashboard of your vehicle where you have all the necessary information in an understandable form. Along the same lines, these dashboards solutions are designed to communicate critical information in an easy way to understand format and promote easy decision-making.
Going for Business Intelligence Dashboards
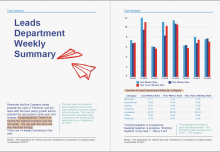
BI dashboards are a type of data visualization tool which show the present status of performance metrics or KPIs. These solutions arrange and combine data from numerous enterprise operational stores enterprise and display everything on a single screen. Thus, these visualization tools are mainly helpful in presenting data in a manner that’s understandable by one and all.
Opt for InetSoft’s Dashboard Visualization Tool
The market is brimming with many BI dashboard visualization tools. InetSoft’s Style Intelligence is one such visual analysis and dashboarding tool. A well-designed dashboard built with InetSoft drag and drop designer presents data in an aesthetic manner to help knowledge workers identify pieces of critical information readily.
What Do You Gain from the Dashboard?
Customized Solutions
The visualization tool can be tailored per the idiosyncratic needs of any company. For instance, the solution can be tailored to suit different functions or different roles of those using the dashboard. A customizable interface and the ability to pull real-time data from multiple sources are essential features of InetSoft’s dashboarding tool.
Applied to Any Industry
A dashboard solution is highly useful in any industry including construction, education, healthcare, insurance, manufacturing, and telecom to name a few.
Helpful in Analyzing Different Functional Areas
Be it Administration, Customer Service, Sales, Financial and Business Management, Inventory Control Purchasing, and other functional business areas, visualization tools can be helpful in obtaining key insights for easy decision-making.
Salient Features
- Archiving snapshots
- Multi-dimensional charting
- Facility to drill down to various views and details
- Dashboard and Visualization explanations
- Leverage use of gauges, thermometers, and familiar objects
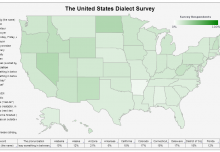
- Use advanced visual displays including charts and maps
- Feature to get information in Excel, PowerPoint, and PDF formats
- Monitoring and analysis oriented views
- Assembled views from sub-level
- Data mashup across multiple data sources
- Alerts for exceptions and business-rule triggers
- Broad assortment of sophisticated chart types like custom geographic mapping
- Option to drag and drop in a web browser along with a spreadsheet-like design
- Mobile dashboards accessible from a browser on Android-, Apple-, and Microsoft-based device
- Ability to bookmark or save explanations and selections as well as chart settings of an analysis for future reference
- Supported by leading web browsers including Chrome, Firefox, Internet Explorer, and Safari even without flash plugin
- Easy connectivity to relational databases (JDBC), Microsoft Excel, and .csv files
Wrap Up
Getting a customized visualization solution for a real-time analysis of business metrics what makes dashboard tools like InetSoft’s dashboarding product a must have. Try BI dashboards and see the difference in the performance of your organization.