
Visualize Free, our easy-to-use visual analysis tool, has been ranked among the ten best data visualization tools by CreativeBloq. There are hundreds of tools out there to help you display your data in a visually appealing way, and we are honored to rank in the top ten.
Visualize Free makes spotting trends or irregularities in multi-dimensional data nearly effortless with a drag & drop designer. Our visual analysis tool allows you to present data in a way that will quickly draw attention to your most important findings. Not only is our tool easy to use, but output can be done using HTML5, making it extremely convenient for anyone to use.
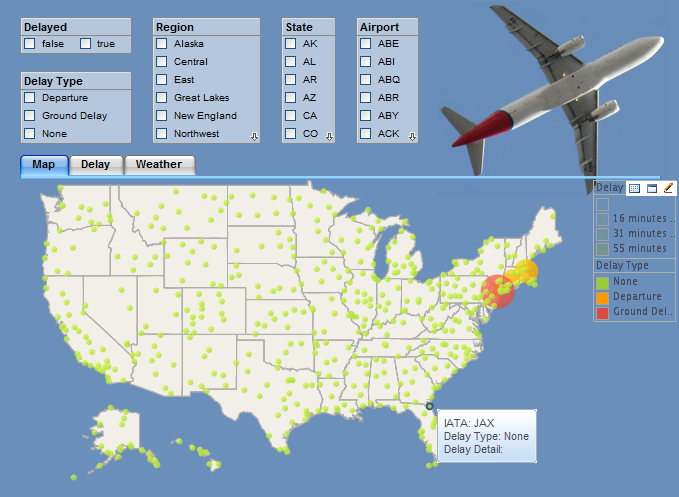
A visualization created with Visualize Free using live feed
January 9, 2014
Related Articles
-
InetSoft’s Data Visualization Software Helps Fight Human Trafficking
-

Interesting Discussion on Visual Data Analysis
-

Machine Learning Algorithm Primer for Non-Techies, Number 2: Machine Discoveries
-

IT Services Provider EuroSpace Selects InetSoft’s Style Scope for Travel Expense Data Management Solutions