Last week, we discussed how charts with stacked dimensions can be useful data analytics tools for drilldown and comparison, if combined with the right selection lists. This week, we’ll discuss a way to make these and other uses even more convenient with another InetSoft feature: bookmarking.
Bookmarks are a quick and easy way for both dashboard creators and consumers to save customized views of a dashboard, both for individual use and to be shared with other users.
To give an example, let’s use a filtered view we created on last week’s example dashboard
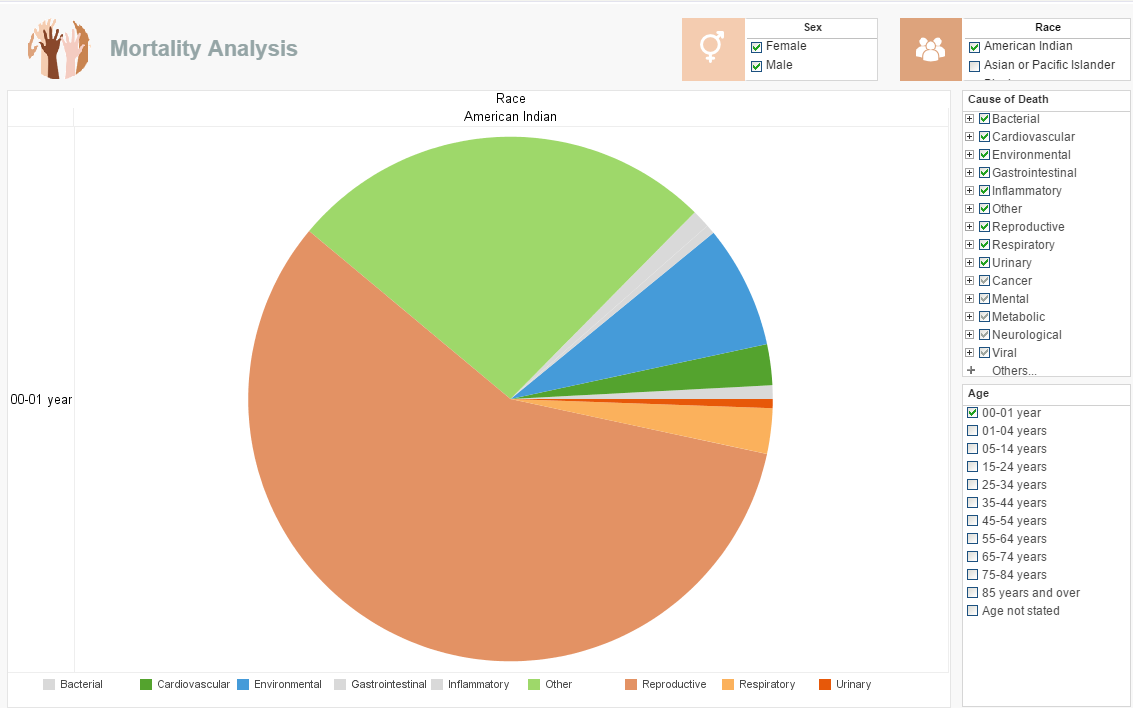
Let’s say that this dataset of Mortality statistics is a database that is being regularly updated with new information, and part of your scientific or healthcare research involves regularly monitoring of the mortality causes of various groups shown on the dashboard, one of them being infant mortality among Native Americans (as depicted above). Instead of clicking the necessary boxes across three selection lists every time, why not create a bookmark? To try this along with the example, you’ll need to either be using one of InetSoft’s enterprise dashboard products, or be signed up for either the inetsoft test drive(requires a corporate email) or visualizefree.com(sign up with any email address).
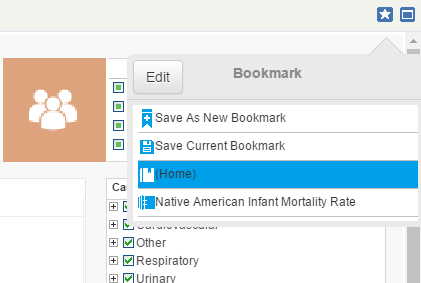
When you’ve made the desired selections, click on the blue star button at the top right corner of the dashboard to access the bookmarks menu. Click “Save As New Bookmark” and give your bookmark a relevant name.
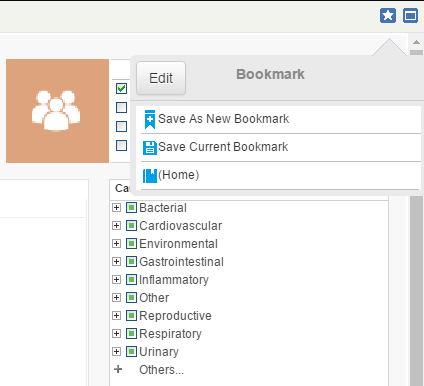
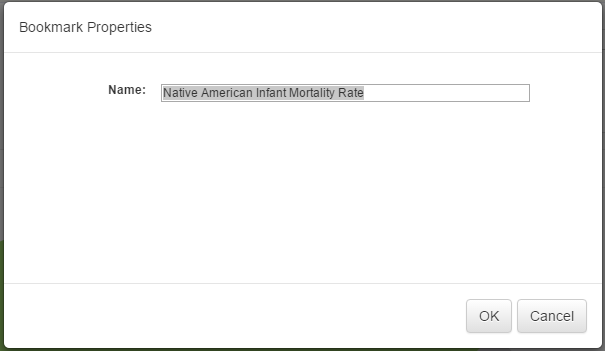
Click OK and now those filter settings will be available for quick selection any time you open the dashboard. Click the Edit option to see a menu allowing you to delete, change the sharing settings (set it to be available just for you or for others as well), or set the bookmark to be the dashboard default view (a sensible choice if it’s your most common drilldown on the dashboard).

In upcoming Mashup posts, we’ll discuss other ways to facilitate quick and easy drilldown and comparisons without sacrificing screenspace, using InetSoft BI dashboard tools such as dropdown menus, radio buttons, multiple tabs and data tip views.