We’ve already discussed several ways to maximize screen real estate in dashboards without sacrificing utility, including using stacked dimensions combined with filters and using bookmarks to save customized drilldowns. This week we’ll discuss another valuable feature of InetSoft’s BI dashboard tools: the ability to place components into a tabbed interface.
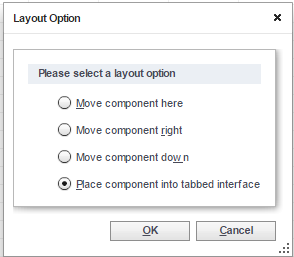
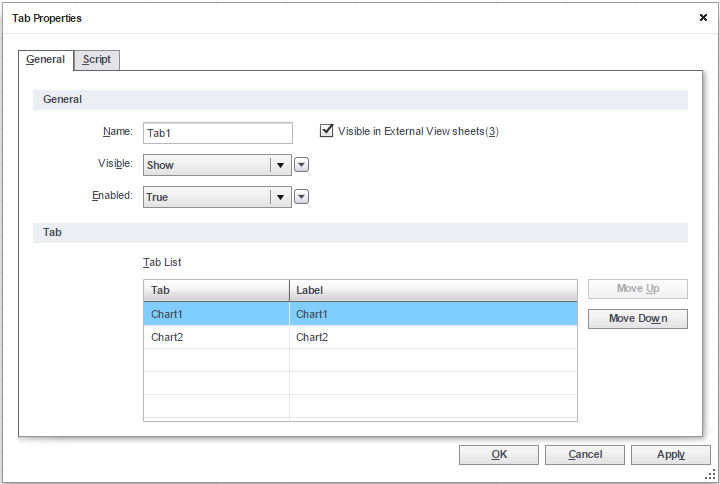
To start with a simple example, let’s say that you have two or more charts you’ve created for your dashboard and you are running out of space. Based on what the charts display, you’ve determined that these charts do not need to be viewed side by side. Simply click on one of the charts and drag it onto one of the others. Select “place component into tabbed interface” and now each chart is on it’s own tab. Repeat this with as many charts as you like. Right click on the tab label and select “properties” to make changes to the labeling and visibility.

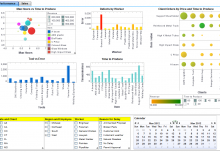
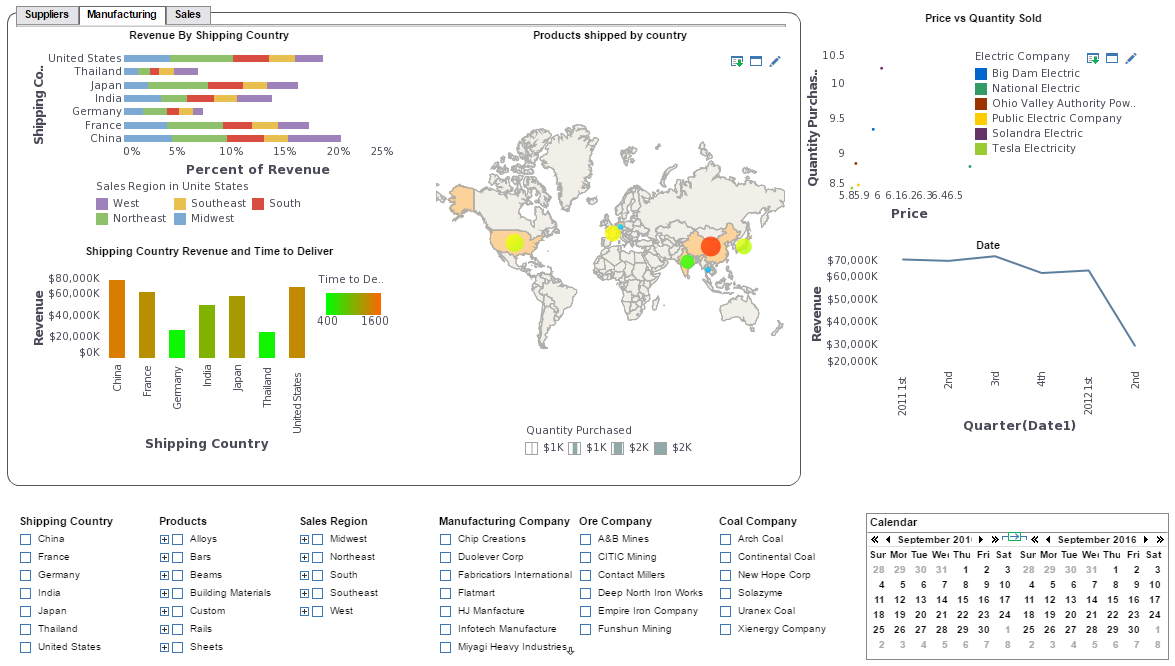
This is certainly a useful feature for flipping between different charts and chart styles. But to take it to the next level of design, consider the utility of having multiple elements on each dashboard tab, instead of just individual charts. This is often used to separate the metrics of different departments or business functions, such as in the steel manufacturing dashboard shown in the two screenshots below.
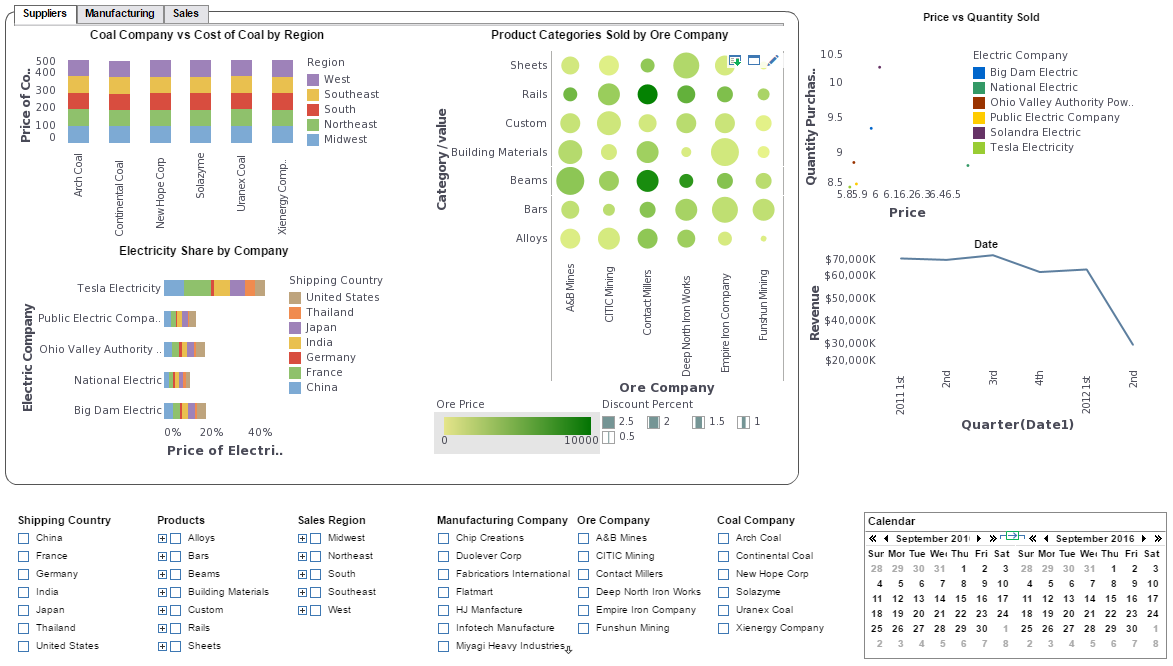
In the second screenshot, notice how the charts at the left of the dashboard and the filters on the bottom do not change as the tabs of charts are flipped through. The charts are more general monitoring charts that are meant to be viewed alongside the various charts for comparison. In cases like these, deciding which charts belong on tabs and which should be visible in all views is a major aspect of effective dashboard design strategy.
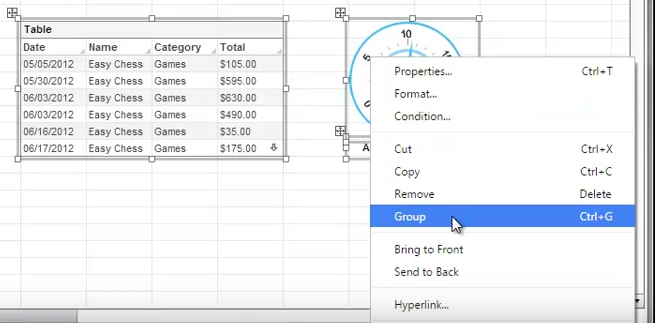
To create tabs with multiple elements on them, the process is the same as placing single charts in tabs, except the elements for each tab must be grouped first. To place elements in a group, select the elements by either dragging the mouse across all of them, or by holding down the CNTRL key while clicking on each element. Right click on any of the selected elements and click “group”. When you have created the groups that you would like to turn into tabs, simply drag the groups on top of each other as you did before.
Stay tuned to The Mashup for more tips on InetSoft features you can use for better dashboard solutions.