We often help our customers create proofs-of-concept, and in so doing, get to understand the kinds of industry-specific KPIs that they need to track and the kinds of interactive analyses that help them run their business. We can then anonymize the data and share these proof-of-concepts here to give you more tangible examples of what can be built with our business intelligence software.
This month’s live interactive example comes from the manufacturing sector. The live interactive reports can be utilized by anyone from the manager on the production floor to executives of the company. Each person using the dashboards can view the relevant KPIs they need to get their jobs done.
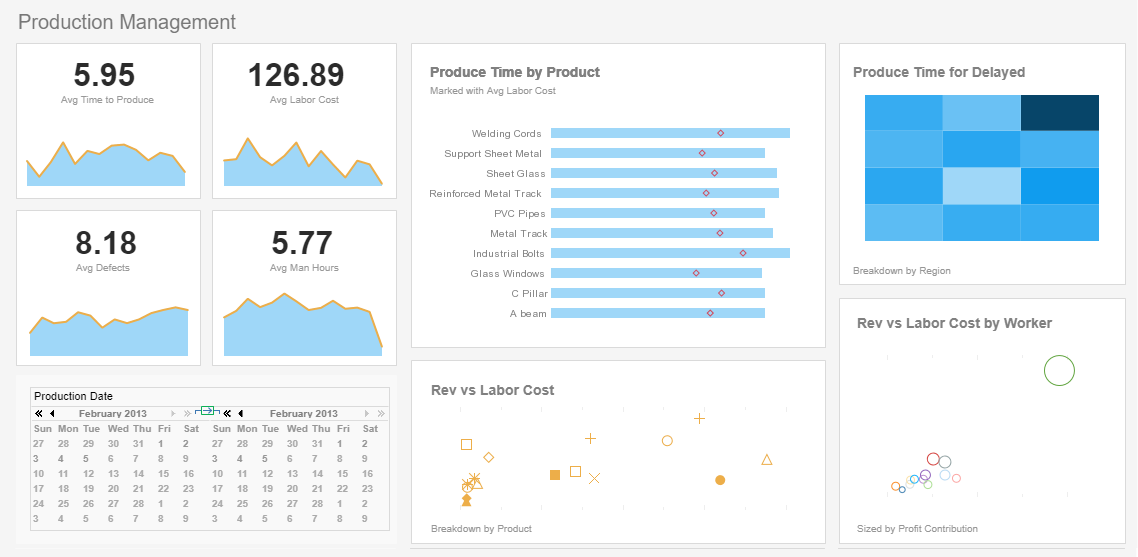
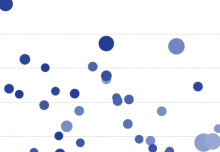
With this sample dashboard, a production manager can track the following KPIs:
- Number of goods being produced without error
- Delays caused by machine downtown
- Errors caused by workers
Whereas an executive of the company can:
- View Summation statistics of company profits
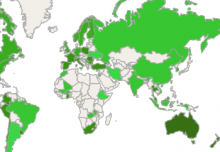
- Find out who are the major customers
- Review safety procedures by measuring worker injuries.
The key performance indicators in manufacturing track both production and sales. By tracking the performance of workers and machines on the production line, manufacturers can seek out cost-cutting opportunities while maintaining product quality. Waste from manufacturing in terms excessive production runs or wastes from defects can be reduced with quicker access to these reports:
- Quality of products being made
- Products produce and profits per worker
- Delays caused by each product manufacturing process
- Cost to sales ratio of each product
- Worker injuries and costs to production
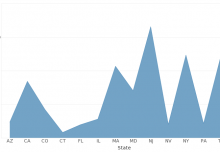
Order management KPIs are a very large part of managing revenue and deciding where to place emphasis on production. With real time information about sales of products, supply chains can be more easily tuned to meet demand fluctuations. Some of the key metrics tracked are:
- Top retail distributors and product sell-through rates
- Revenue by sales representative
- Revenue by product or product group sold
- Delays caused by shipping problems
- Order cancellations or returns
Try the InetSoft manufacturing analytics dashboard.