This week we’re sharing a supply chain dashboard that is based on a proof of concept we helped one for our customers with. The data has been anonymized, of course, and these supply chain KPI’s could apply to many different types of manufacturers and product companies.
With an ever-increasing global trade and interconnectivity it is imperative for companies to be able to track a complete product lifecycle from creation to shipping and then sales. The dashboards could be specific to a certain department or the management of the entire global company. Tracking KPI’s using live dashboards help the company to alerted in real-time by problems or delays as they arise during the entire production and sales cycle. Active tracking also helps the company reduce waste from excess costs and also continue to improve the product. These processes can help the company continue to keep the competitive edge.
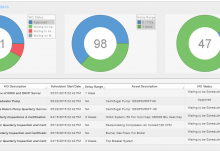
KPIs for the shipping department can include:
- Cost to ship from plant
- Time to ship product
- Product safety during shipping
KPIs for the management of the company can include
- Cost during manufacturing of product
- Time vs Cost of shipping product
- Global safety of employees
- Revenues by sales team
By tracking performance of workers and machines on the production line allow for cost cutting procedures, while maintaining product quality. Waste from manufacturing in terms excessive production runs or wastes from defects can be reduced with quicker reports.
- Quality of Products being made
- Products/profits per worker
- Delay from products manufacturing
- Cost to sales ratio of product
- Work Injuries and costs to production
- Analyze types of products being sold
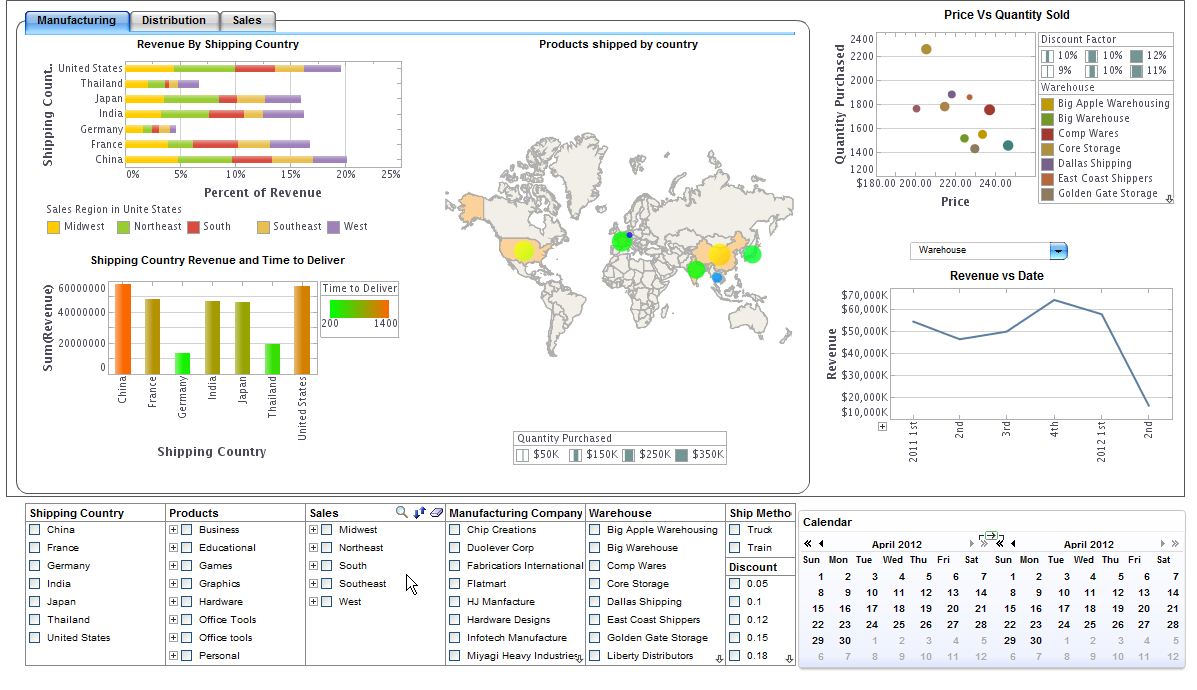
Distribution management KPIs are key to delivering the product on time to retail shelves and mange how to efficiently ship products from manufacturing locations. With this knowledge shortages in retail stores could be drastically reduced while decreasing surplus production.
- Warehouse share of revenue by region
- Warehouse revenue by shipment
- Products sold stocked and sold by warehouse
- Track the gross discounting at warehouse
- Price of each good sold
Order management KPIs are very large part of managing revenue and deciding where to place emphasis on production. . With real time information about sales of products supply chains can be quickly ramped up to meet demand.
- Top companies vs products bought
- Sales representative and revenue
- Revenue by product or product group sold
- Delays cause by shipping
- Order cancellations or returns
Try InetSoft’s supply chain reporting software.