For his most recent quarterly newsletter, data visualization expert Stephen Few, published an extremely useful and thorough guide for evaluating visual exploratory data analysis software like ours. The 10-page document starts by defining the fundamental data access capabilities required with data mashup of multiple data sources being essential.
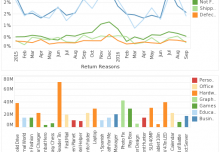
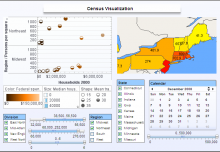
Next Stephen lists and explains all of the interesting advanced visual analytics tools such as heatmap matrices, choropleth maps, bullet graphs, node-link graphs, dendograms, and trellis charts.
Then he goes on to describe the necessary interactivity features, built-in statistical functions, output options, content management features and so. It certainly makes a useful guide for BI software evaluators, and we believe our visualization software stacks up well against it.
To download the guide, please go to:
http://www.perceptualedge.com/articles/visual_business_intelligence/evaluating_visual_eda_tools.pdf