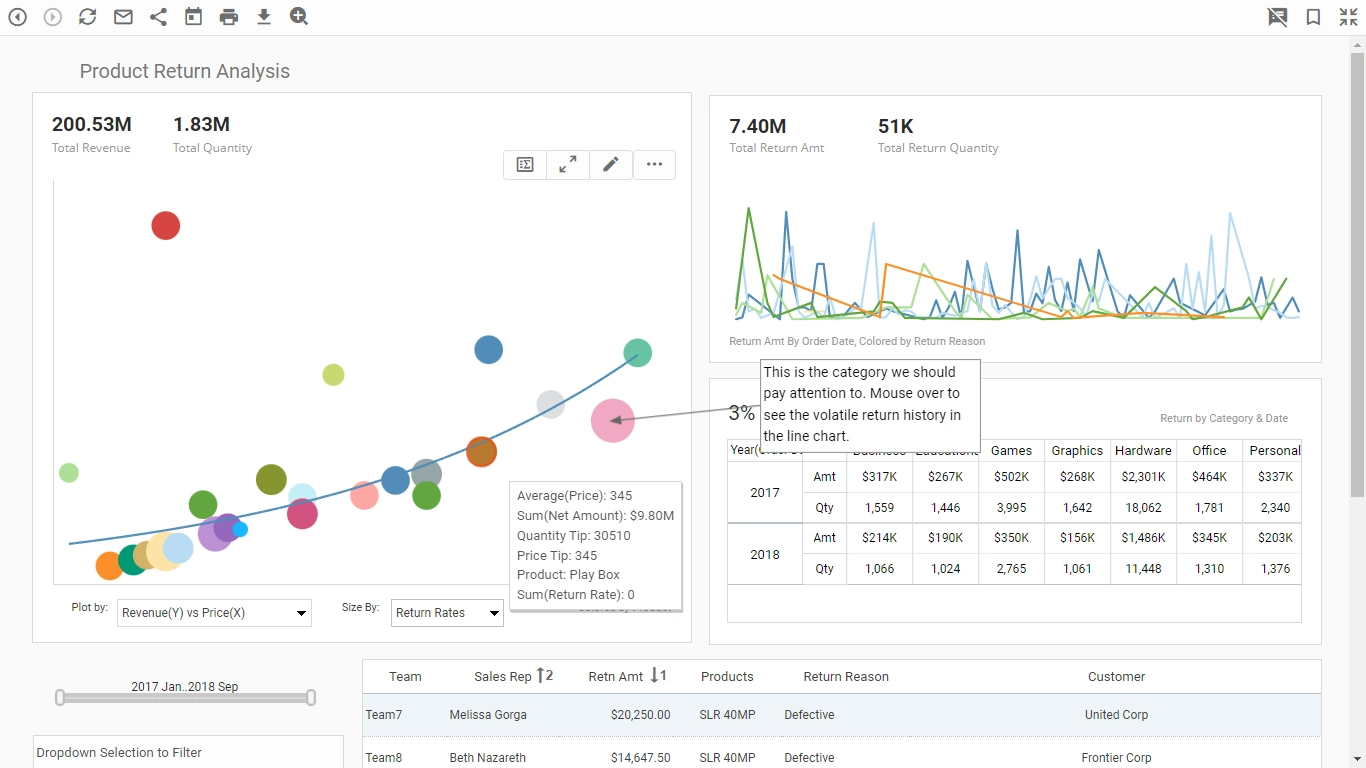
Searching for a Commercial Business Dashboard?
Dashboards create visual representations of metrics and performance scorecards at a specific point in time. In order for a manager to fully understand the status of key performance indicators, it is a necessity to have an advanced and interactive dashboarding tool.
InetSoft's Commercial Dashboard Application: Style Scope
The Style Scope by InetSoft provides users with an interactive and intuitive dashboarding tool with the ability to report in real-time. As a Java-based application, it delivers web-based dashboards and visuals. Conveniently, InetSoft’s Style Scope design enables data and information sharing within a company.
InetSoft implements a unique patent pending technology design called Data Block™ which enables data mashup in a Lego-like block fashion. Quick business decisions are possible due to the high-performance, secure data blocks which are transformed and assembled by business users for real-time business questions.

Style Scope's Data Capabilities
- Real-time data mashup Data Block architecture
- Professional atomic data block modeling tool
- End user data mashup on the Web
- Connectivity to relational databases (JDBC), multidimensional databases, XML, SOAP, Java beans (POJO), Microsoft Excel, flat files, OLAP cubes, SAP, PeopleSoft, JD Edwards, Siebel CRM, and many more cloud sources
- Security control at the data cell level for users, roles and groups
- Data mashup across domains and multiple data sources
- High performance scalability for large data sets and large volumes of users via InetSoft's Data Grid Cache technology
- Embedded dashboarding - a Java-style API and multiple integration points allow developers maximum control over programmatic use of dashboarding and reporting
Visualizations and Dashboards Features
- Mobile dashboards accessible from Web-enabled devices including Android-based tablets, smartphones, iPads, and iPhones
- All popular Web browsers supported with or without a plugin - e.g., Chrome, Internet Explorer, Firefox, Safari
- Unlimited multi-dimensional charting
- Brushing for data exploration
- Drilldown across views and into details
- Wide range of sophisticated chart types including custom geographic mapping
- Visualization view re-use and collaboration
- Drag and drop design in a Web browser, spreadsheet-like design
- Use gauges, thermometers, and other familiar objects
- Use charts, maps, and other advanced visual displays
- Dual purpose input/output elements
- Views assembled from sub-level views
- Monitoring and analysis oriented views
- Export to Excel, PowerPoint, PDF, RTF-Word, CSV, PostScript, Text, and SVG
- Alerts for exceptions or business-rule triggers
- Snapshot archiving

What KPIs and Metrics Are Tracked in a Shopping Cart Dashboard?
A shopping cart dashboard is a crucial tool for e-commerce businesses to monitor and optimize their online sales performance. It provides valuable insights into various key performance indicators (KPIs) and metrics that help gauge the effectiveness of the online store, understand customer behavior, and identify areas for improvement. Here are some of the KPIs and metrics commonly tracked in a shopping cart dashboard:
-
Conversion Rate: This is one of the most important metrics, indicating the percentage of visitors who make a purchase compared to the total number of visitors. A high conversion rate suggests effective marketing, user experience, and product offerings.
-
Cart Abandonment Rate: This metric shows the percentage of users who add items to their cart but leave the website without completing the purchase. A high abandonment rate could indicate issues with pricing, shipping costs, or checkout process.
-
Average Order Value (AOV): AOV represents the average amount of money spent by customers in a single transaction. Monitoring AOV helps in understanding spending patterns and devising strategies to increase sales value.
-
Revenue: Tracking total revenue generated over a specific period provides a clear picture of the overall sales performance.
-
Product Performance: Analyzing the performance of individual products, including sales volume, revenue generated, and conversion rates, helps in optimizing product offerings and marketing strategies.
-
Customer Lifetime Value (CLV): CLV predicts the total revenue a customer is expected to generate throughout their relationship with the business. It helps in prioritizing customer acquisition and retention efforts.
-
Customer Acquisition Cost (CAC): CAC represents the cost incurred to acquire a new customer. Monitoring CAC helps in evaluating the effectiveness of marketing campaigns and optimizing acquisition strategies.
-
Retention Rate: This metric indicates the percentage of customers who return to make additional purchases. A high retention rate signifies customer satisfaction and loyalty.
-
Checkout Funnel Metrics: Tracking various stages of the checkout process, such as cart abandonment rate at each stage, helps in identifying friction points and optimizing the checkout experience.
-
Traffic Sources: Analyzing the sources of website traffic (e.g., organic search, paid advertising, referrals) provides insights into the effectiveness of marketing channels and helps in allocating resources accordingly.
-
Mobile vs. Desktop Performance: Differentiating between conversions and behaviors on mobile devices versus desktops helps in optimizing the user experience for each platform.
-
Inventory Management Metrics: Monitoring inventory levels, stock turnover rates, and out-of-stock occurrences ensures adequate product availability and minimizes lost sales opportunities.
-
Shipping and Fulfillment Metrics: Tracking shipping costs, delivery times, and fulfillment accuracy helps in optimizing logistics operations and enhancing the post-purchase experience for customers.
-
Customer Satisfaction Metrics: Collecting feedback through surveys, reviews, and ratings helps in measuring customer satisfaction and identifying areas for improvement.

More Articles About KPI Dashboards
-
Comprehensive Lists Of Industry Specific KPIs
This article collects an array of key performance indicator lists and definitions tailored to a wide variety of industries and operational contexts. It includes gaming app engagement measures, enterprise asset utilization metrics, and rail operator performance measurements among other sector-specific KPIs. Readers will also find metrics used in fields such as field service mobility, navigation apps, zoning compliance, and nonconformance tracking. The resource emphasizes how industry-relevant KPIs can drive better decisions by providing concrete definitions and context for measurement. It serves as a go-to reference for identifying what to track in diverse operational environments spanning technology, transportation, and service delivery.
-
Technology Team Measurable Outcome Metrics
This page focuses on key performance indicators tailored to information technology teams and infrastructure performance. It highlights system uptime, mean time to recovery, and mean time between failures as essential availability and reliability metrics. Security and compliance measurements such as incident response time and patch management compliance are explained with relevance to risk mitigation. The article also covers user experience KPIs like first call resolution and average response time for IT support teams. Financial and resource management indicators such as cost per employee are presented to help IT leaders benchmark efficiency and value delivery.
-
Operational Metrics Reporting For Manufacturers
This article explains what a KPI report entails and why dashboards that display critical metrics are indispensable for performance evaluation. It includes an illustrative case from a precision manufacturing context, where dashboards modernized KPI reporting for operational efficiency and quality consistency. Key tracked indicators such as overall equipment effectiveness, scrap rate, and cycle time are described in terms of production impact. The narrative also discusses on-time delivery rates and cost per unit as financial and operational success measures. The report underscores how integrating real-time insight from diverse sources into KPI reports enables better decision-making on the factory floor and in executive planning.
-
Supply Chain And Compliance Metric Definitions
This resource delves into how business intelligence software can monitor a comprehensive set of KPIs across industry functions such as supply chain, regulatory compliance, and inventory management. It presents specific measures for a CBD manufacturing scenario, including supplier reliability, batch quality pass rates, and lead time to delivery. Compliance KPIs like THC compliance rate and audit readiness score are explained for highly regulated environments. The article also addresses inventory turnover and refund rates as critical operational indicators for warehouse efficiency. Financial performance metrics such as gross margin and burn rate are discussed to connect operational health with overall business viability.
-
Visual Production Efficiency And Errors Monitoring
This article describes a manufacturing metrics dashboard that visually represents critical KPIs to support peak performance and process insight. It highlights how production managers can track counts of defect-free goods, machine downtime delays, and worker-caused errors in real time. The dashboard also allows executives to view profit summaries, major customer identification, and safety procedure measurements. An example implementation showcases linking ERP work order data with shop floor metrics to transform static reports into interactive analytics. The piece emphasizes how these dashboards empower teams to respond quickly to production challenges and confidently manage operational risk.