Single-Stack, Small-Footprint
Enterprise BI
Data Prep, Analytic Dashboards & Document Reports in One
Powered by a Data Acceleration Engine Scalable to Big Data
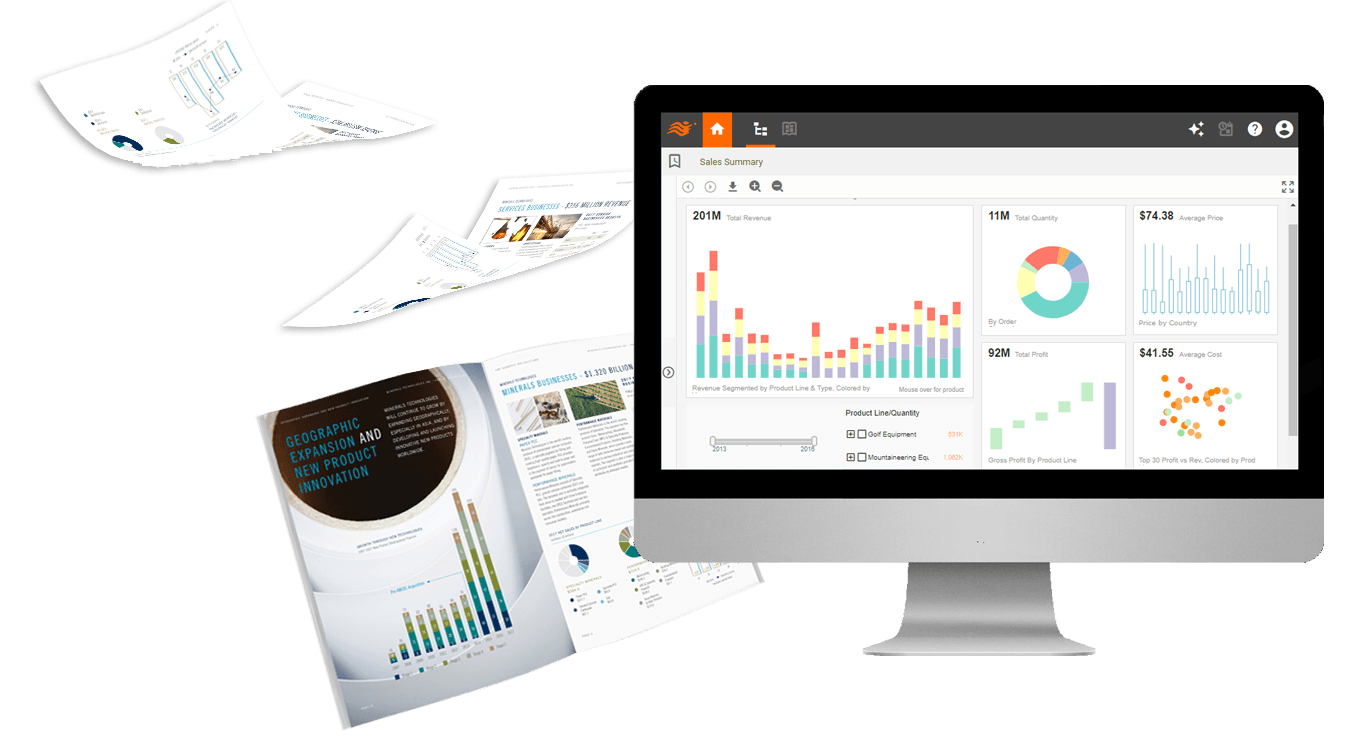
Award winning, trusted by 5,000+ customers since 1996


Easily prepare data and design visual reports in a single Web App
Built-in, in-depth self-service business intelligence for all users
Bring business intelligence software to your data, in-cloud or on-premise
Risk Free Starter:
We create reports with your data (or mentor you to do so)
You use the reports/software for free (as a single user)
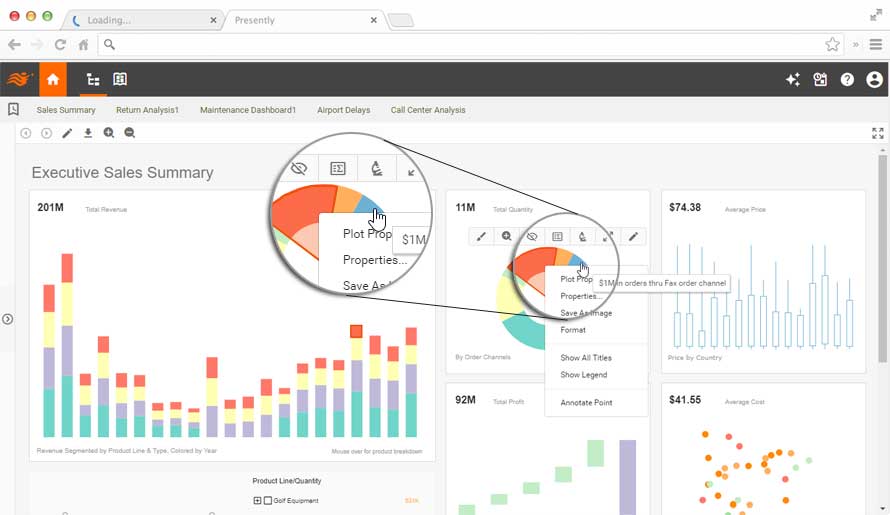
Business Users: Interactive Reports & Dashboards with Rich Customization and Ad Hoc Reporting
Built-in, in-depth interactivity and customization allows business users to dynamically reshape
pre-designed reports for changing business needs with zero training. Ad hoc reporting further empowers business
users with direct access to underlying data assets in a governed and secure environment.
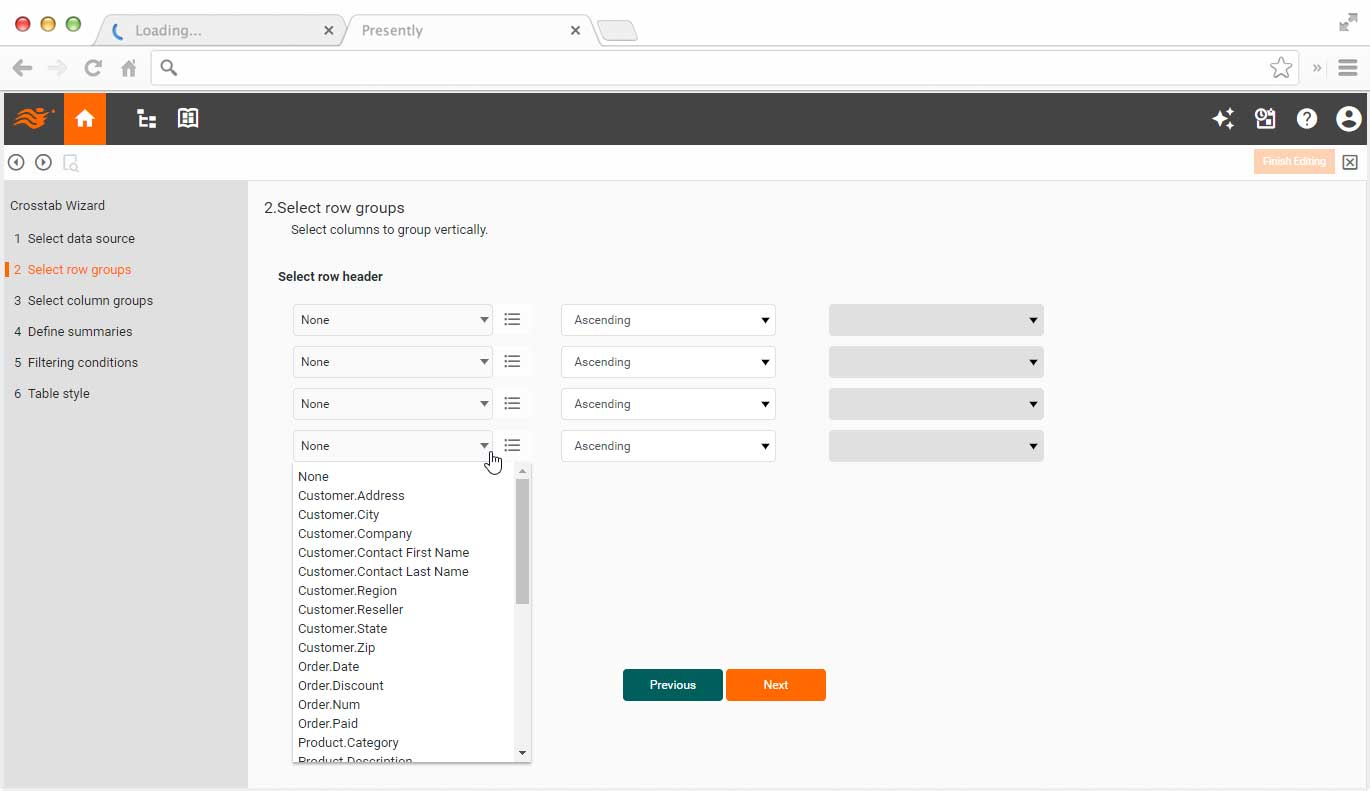
Designers: Rapidly Prepare Data and Design Visual Reports
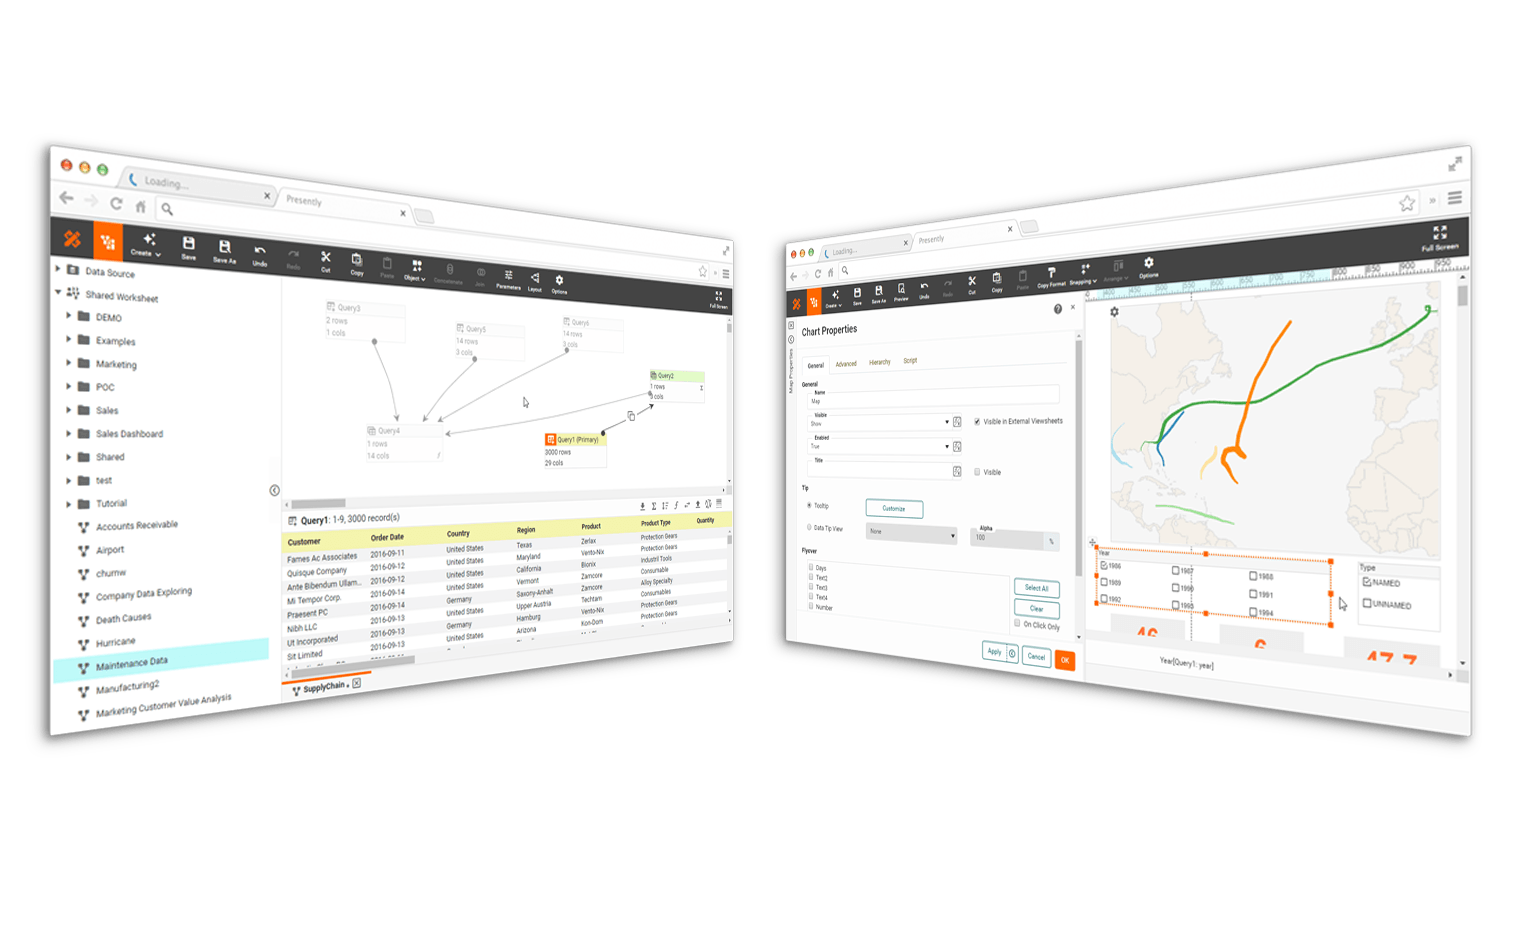
Designers can prepare and mashup data from many data on-line and on-premises sources. Report
design is integrated with data preparation in a single web app. The same web app also includes a user portal where
designers can engage business users even during report design.
Data Specialists: Mashup Machine Learning with Business Intelligence
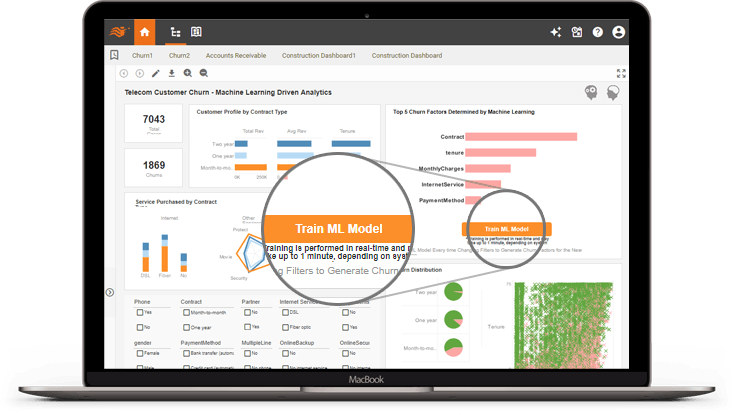
InetSoft's built-in machine learning foremost allows data scientists easily productionalize ML
models so that business users can visualize and interact with machine learning models. ML and BI mashup delivers a
level of intelligent reports that's not possible in traditional reporting solutions
Spotlight on Business Intelligence for a Sports Betting Platform
A Business Intelligence (BI) Analyst at a sports betting platform plays a critical role in analyzing data to drive strategic decisions and optimize business performance. In such a dynamic and competitive industry, there are several key performance indicators (KPIs) and metrics that BI analysts typically track to assess the health of the business, understand customer behavior, and identify opportunities for improvement. Here are some of the most important ones:
- Revenue and Profitability Metrics:
- Gross Gaming Revenue (GGR): Total amount wagered minus payouts to customers.
- Net Gaming Revenue (NGR): GGR minus bonuses, promotions, and other incentives.
- Profit Margin: Percentage of revenue retained after deducting all costs.
- Return on Investment (ROI): Measure of profitability relative to the amount invested in marketing, technology, and other operational expenses.
- Customer Acquisition and Retention Metrics:
- Customer Acquisition Cost (CAC): Average cost to acquire a new customer through marketing and advertising efforts.
- Customer Lifetime Value (CLV): Predicted net profit attributed to the entire future relationship with a customer.
- Churn Rate: Percentage of customers who stop using the platform within a given period.
- Repeat Customer Rate: Percentage of customers who make more than one transaction over a specific period.
- Operational Efficiency Metrics:
- Bet Frequency: Average number of bets placed per customer over a specific period.
- Average Bet Size: Mean amount wagered per bet, indicative of customer engagement and risk appetite.
- Payout Ratio: Percentage of total wagers paid out as winnings to customers.
- Betting Handle: Total amount wagered on the platform during a specific period.
- Risk Management Metrics:
- Exposure: Total amount at risk due to outstanding bets.
- Liability: Potential loss incurred if all outstanding bets are settled as losses.
- Risk Profile: Assessment of potential risks associated with specific betting markets, events, or customer segments.
- Marketing and Campaign Effectiveness Metrics:
- Click-Through Rate (CTR): Percentage of users who click on a specific marketing campaign or advertisement.
- Conversion Rate: Percentage of users who complete a desired action (e.g., sign up, make a deposit) after clicking on a marketing campaign.
- ROI by Marketing Channel: Measure of the return on investment for various marketing channels such as PPC advertising, affiliate partnerships, social media, and email campaigns.
- Customer Behavior and Engagement Metrics:
- Session Duration: Average time spent by users on the platform per session.
- Active Users: Number of unique users who engage with the platform within a given timeframe.
- Customer Segmentation: Analysis of user behavior and preferences to identify high-value segments and tailor marketing strategies accordingly.
- Regulatory Compliance Metrics:
- Responsible Gambling Metrics: Monitoring and tracking adherence to responsible gambling guidelines and regulations, including self-exclusion rates and responsible gambling tools usage.
- Compliance Monitoring: Ensuring adherence to legal and regulatory requirements related to data privacy, anti-money laundering (AML), and Know Your Customer (KYC) regulations.
- Product Performance Metrics:
- User Feedback and Satisfaction: Gathering and analyzing user feedback to understand pain points, preferences, and areas for improvement.
- Feature Adoption Rate: Percentage of users who engage with new features or products introduced on the platform.
- Platform Stability: Monitoring uptime, latency, and performance to ensure a seamless user experience.
Sample Customers



|





|
We will help you get started
Contact us