Cloud Systems to Embed Insights
Below is the continuation of the transcript of a Webinar hosted by InetSoft on the topic of the Power of Data with Embedded Analytics Tools. The presenter is Abhishek Gupta, Chief Data Scientist at InetSoft.
This is important for these kinds of specialized cloud systems to embed insights. They are beginning to develop another kind of term of art out there as opposed to being just systems of record and business or transactional systems. They are certainly growing around business analytics and BI and so forth.
To build out these systems that different types of users can use, as we've been talking about here to make good use of data, to bring data in, to have data-driven decision-making, and to be able to collaborate on data. To use things like data storytelling to explain what they're seeing and maybe in a predictive trend that they can build predictions off of, and then make recommendations for different kinds of actions to improve processes or operations.
To be able to plug these in, use that kind of cloud development infrastructure I was talking about, is very valuable and important. Using open APIs, call the microservices, using standards instead of just specialized APIs or specialized connectors that use standards effectively can improve connectivity, enable easier data flow between them and allow for more customizable functionality.
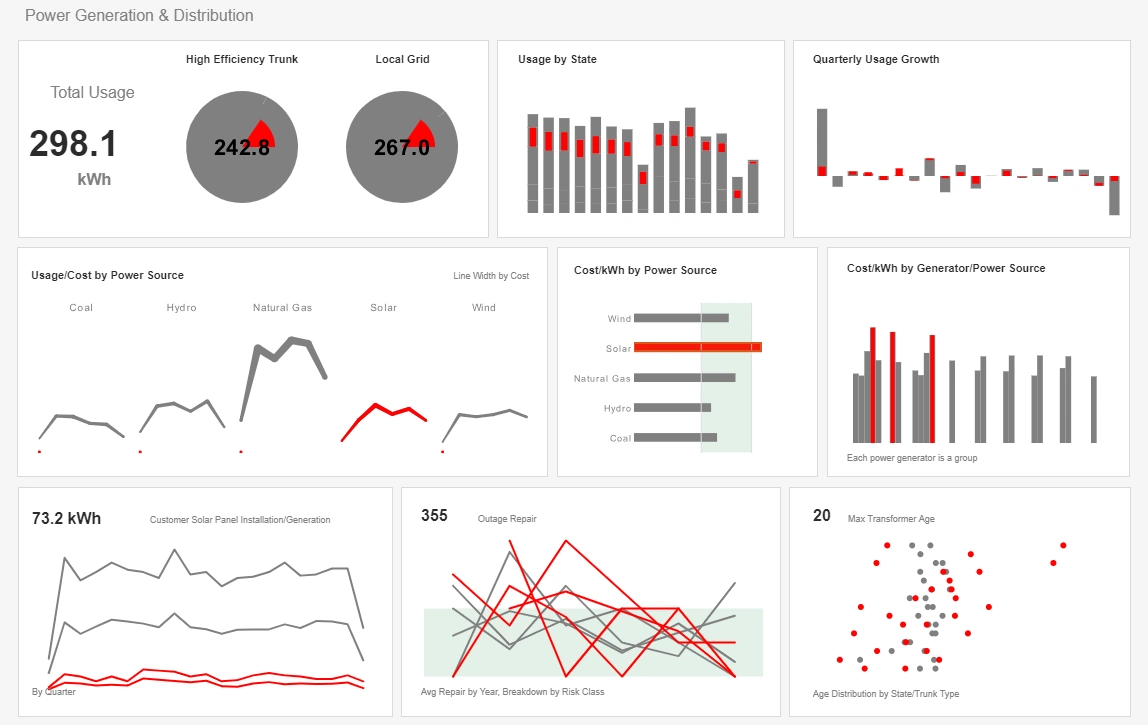

Embedded BI for Third Party Developers
Through this way you can easily serve third party developers' customers' needs for expanding data interaction and increasing flexibility. Then also as I mentioned, different points in the workflows often become a frustration users have with embedded systems. It could invoke an embedded report maybe at one point, but they really need that capability at another point in the business process workflow. Can they provide it there?
This is another thing which is necessary: easier connectivity and customizable functionality enabling analytics to be contributing at different points in a workflow or in a business process. Not just for third party developers, I think there's an important point here is that because of the Cloud really and Cloud-based capabilities, it's no longer just the realm a third party developers, but organizations themselves can now look at how they can create applications and services for their customers, for their partners and for their employees to make it easier for everyone to interact, collaborating and be productive.
There's a lot of potential here, and this is where organizations are looking at the potential for things like monetizing data and analytics, which is really around productizing data flows or productizing certain kinds of analytics for external partners or customers or consumers. But I think it's important to make the point that you can take that same idea and think about how different employees in the organization, particularly, in larger organizations have different types of employees might be served by a similar idea.

Cost of Advanced Analytic Systems
The cost of those advanced analytic systems and who pays for it can be worked out actually in an economic way as well, but we won't get into that here. But there's obviously a lot of options there in terms of how an organization might productize it for internal employees or different subsidiaries around, and how it gets paid for it. It's compelling to be able to use some of these economic models that work on the outside to be able to use the money inside as well.
But, in general what I'm just talking about here i s that they can use the same idea of trying to figure it out, innovate by productizing data analytics for the se different kinds of either external, internal users. Again, keeping in mind of the three things that are important, one is governance, this way, the importance of being able to build them according to internal governance and data m anagement standards.
I think the use of a standardized API's connectivit y and so forth is a big part of that because then you can begin to plug-in knowledge of the data through data catalogs, being able to understand data lineage, be able to track that across vast use of embedded systems.

Embedding InetSoft Analytics in Agricultural Supply Chain Software: A Developer’s Deep Dive
Agricultural supply chains have become some of the most data‑intensive operational ecosystems in the world. From field sensors and drone imagery to pack‑house throughput logs and cold‑chain temperature telemetry, modern ag‑tech platforms must ingest, normalize, and interpret massive volumes of heterogeneous data. For developers building agricultural supply chain management software, embedding a flexible analytics layer is no longer optional—it is the backbone that enables growers, co‑ops, processors, and distributors to make timely, data‑driven decisions. This article explores how a maker of agricultural supply chain software integrates InetSoft’s embedded analytics platform to deliver dashboards, KPIs, and operational reporting tailored to the unique demands of the farm‑to‑fork lifecycle.
Unlike horizontal SaaS products, agricultural supply chain systems must model highly specialized workflows: crop planning, harvest scheduling, inbound quality grading, pack‑line optimization, logistics orchestration, and regulatory compliance. Each workflow generates its own data structures and performance indicators. Developers often struggle to build a reporting layer that can adapt to these domain‑specific needs without hardcoding dozens of custom visualizations. InetSoft’s embedded analytics framework solves this by providing a semantic modeling layer, a scalable data mashup engine, and a fully embeddable dashboard runtime that fits seamlessly into existing web applications. For agricultural software vendors, this means they can expose analytics to growers and supply chain managers without maintaining a separate BI stack.
At the core of the integration is InetSoft’s data worksheet layer, which developers use to blend operational datasets—harvest logs, soil moisture readings, pesticide application records, pack‑house throughput, shipment manifests, and cold‑chain sensor streams—into unified analytical models. These worksheets become the foundation for dashboards that track KPIs such as yield per acre, forecast accuracy, grade‑out percentage, pack‑line efficiency, cold‑chain compliance rate, and on‑time delivery performance. Because agricultural data often arrives in irregular intervals and formats, the worksheet layer’s transformation functions allow developers to normalize timestamps, interpolate missing sensor readings, and align multi‑source data into coherent time‑series structures.
One of the most widely used dashboards in the embedded solution is the Harvest Performance Overview. This dashboard combines geospatial visualizations, time‑series charts, and KPI tiles to give growers a real‑time view of field productivity. A map visualization displays field boundaries colored by yield variance, while a line chart tracks yield per acre over the season. Developers configure drill‑downs so users can click a field polygon to view block‑level metrics such as moisture stress, nutrient application history, and predicted harvest windows. InetSoft’s ability to handle large geospatial datasets without degrading performance is particularly valuable for large farms and co‑ops managing thousands of acres.

Another critical component is the Quality Grading and Pack‑House Efficiency Dashboard. Agricultural supply chains live or die by quality consistency, and processors need immediate visibility into grade‑out rates and defect patterns. Developers embed stacked bar charts showing defect categories—bruising, discoloration, size variance—alongside Pareto charts that highlight the most common causes of rejections. A throughput gauge displays pack‑line units per hour, while a heatmap reveals bottlenecks across shifts and equipment stations. Because InetSoft supports row‑level security, processors can restrict visibility so that growers only see quality results for their own lots, while pack‑house managers see the full operational picture.
Cold‑chain integrity is another area where embedded analytics becomes indispensable. Perishable goods must remain within strict temperature thresholds from harvest to delivery, and deviations can result in spoilage, regulatory violations, or rejected loads. Developers use InetSoft to build a Cold‑Chain Compliance Report that aggregates IoT sensor data from refrigerated trucks, storage rooms, and distribution centers. A time‑series chart plots temperature readings against acceptable ranges, automatically highlighting excursions. A compliance KPI tile calculates the percentage of shipments that remained within tolerance for the entire journey. For deeper analysis, users can drill into a shipment to view minute‑by‑minute telemetry, GPS traces, and driver notes—all rendered through InetSoft’s embedded components.
Forecasting and planning workflows also benefit from InetSoft’s modeling capabilities. Agricultural supply chains must anticipate labor needs, packing capacity, transportation availability, and market demand. Developers integrate predictive models—often built in Python or R—into InetSoft worksheets, enabling dashboards that project harvest volumes, labor hours, and pack‑line utilization. A waterfall chart illustrates how forecast adjustments propagate through the supply chain, while a scenario comparison view lets planners evaluate the impact of weather changes, pest outbreaks, or market price shifts. Because InetSoft supports parameterized dashboards, planners can adjust assumptions interactively without requiring developers to rebuild reports.
Traceability and compliance reporting represent another major use case. Regulations such as FSMA require detailed documentation of product movement, lot genealogy, and safety checks. Developers use InetSoft to generate Traceability Chain Reports that visualize the full journey of a lot—from field harvest to pack‑house processing to outbound shipment. A Sankey diagram shows the flow of product through each stage, while a tabular report lists timestamps, handlers, equipment IDs, and inspection results. Exportable PDF versions allow compliance officers to submit documentation to auditors or customers. Because InetSoft supports scheduled report generation, the system can automatically produce daily or weekly compliance summaries without manual intervention.

From a developer’s perspective, embedding InetSoft also simplifies multi‑tenant architecture. Agricultural software vendors often serve growers, processors, and distributors across multiple regions, each with different crops, workflows, and reporting needs. InetSoft’s tenant‑aware configuration allows developers to define shared dashboard templates while customizing data sources, security rules, and KPI definitions per tenant. This reduces code duplication and ensures that updates to visualizations propagate consistently across the entire customer base. The platform’s REST APIs allow developers to automate provisioning, user management, and dashboard deployment as part of their existing DevOps pipelines.
Front‑end integration is equally straightforward. Developers embed InetSoft dashboards using iframe‑based integration or JavaScript APIs, depending on the level of customization required. For applications that need a seamless UI, the JavaScript API allows developers to synchronize filters, theme dashboards to match the host application, and trigger events when users interact with charts. For example, clicking a bar in a defect analysis chart can trigger a custom modal showing photos of defective produce, or selecting a field on a map can update a side panel with agronomic recommendations. Because InetSoft supports responsive layouts, dashboards render cleanly on tablets and mobile devices used by field supervisors and warehouse staff.
Performance considerations are especially important in agricultural analytics, where datasets can include millions of sensor readings or decades of historical yield data. InetSoft’s caching engine and query optimization features help developers deliver sub‑second interactions even when working with large datasets. For real‑time IoT streams, developers can configure incremental refresh intervals so dashboards update continuously without overwhelming the database. When paired with cloud‑native data warehouses, the embedded solution scales elastically to support seasonal spikes during harvest or shipping peaks.

Ultimately, embedding InetSoft transforms agricultural supply chain software from a transactional system into a decision‑intelligence platform. Growers gain visibility into field performance, processors optimize quality and throughput, logistics teams maintain cold‑chain integrity, and compliance officers streamline documentation. For developers, the integration provides a flexible, maintainable analytics layer that adapts to the evolving needs of the agricultural ecosystem. As the industry continues to digitize and adopt precision agriculture, the ability to deliver rich, domain‑specific analytics will become a key differentiator for software vendors. InetSoft’s embedded BI capabilities give developers the tools to meet that challenge with confidence.