Solution for Crystal Reports Conversion
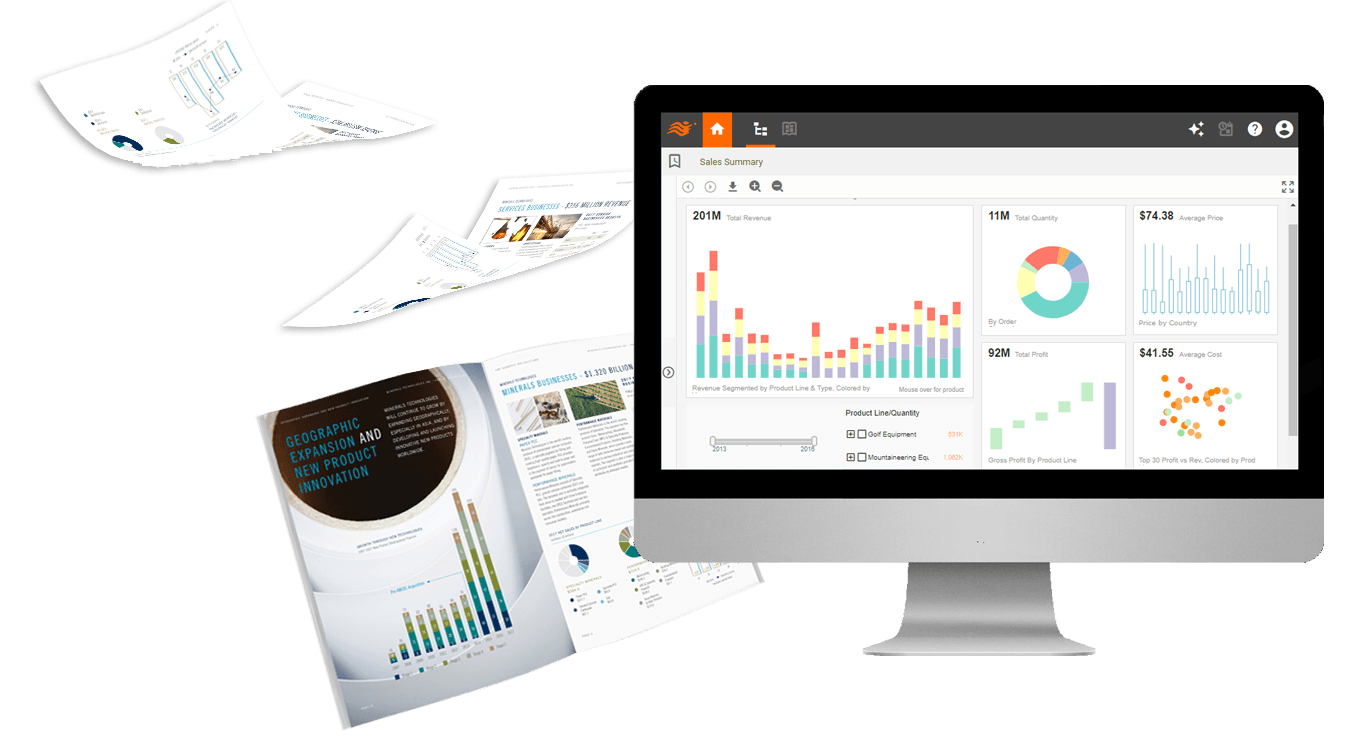
Online and Offline Document Reports
Easy Start and Rapid Deployment
with Free Dedicated Assistance
Award winning, trusted by 5,000+ customers since 1996


Free Migration Assessment
We have experience with many Crystal Reports migrations.
We can assess your current reports and accelerate your conversions.
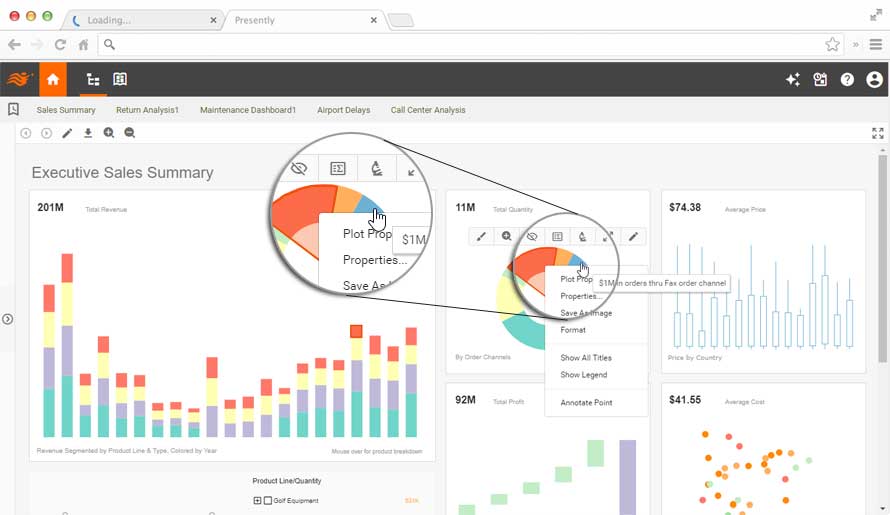
Business Users: Interactive Reports with Rich Customization and Ad Hoc Reporting
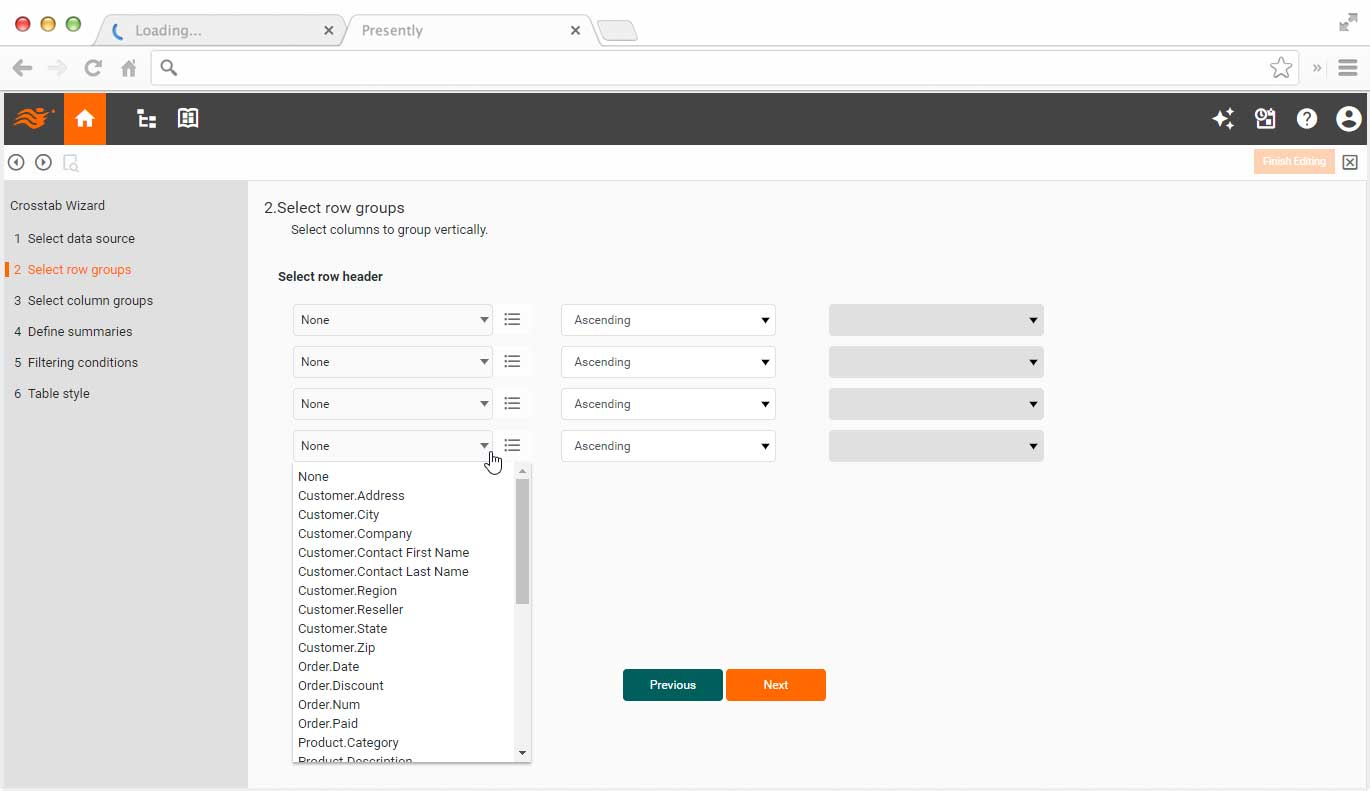
Designers: Rapidly Prepare Data and Design Visual Reports
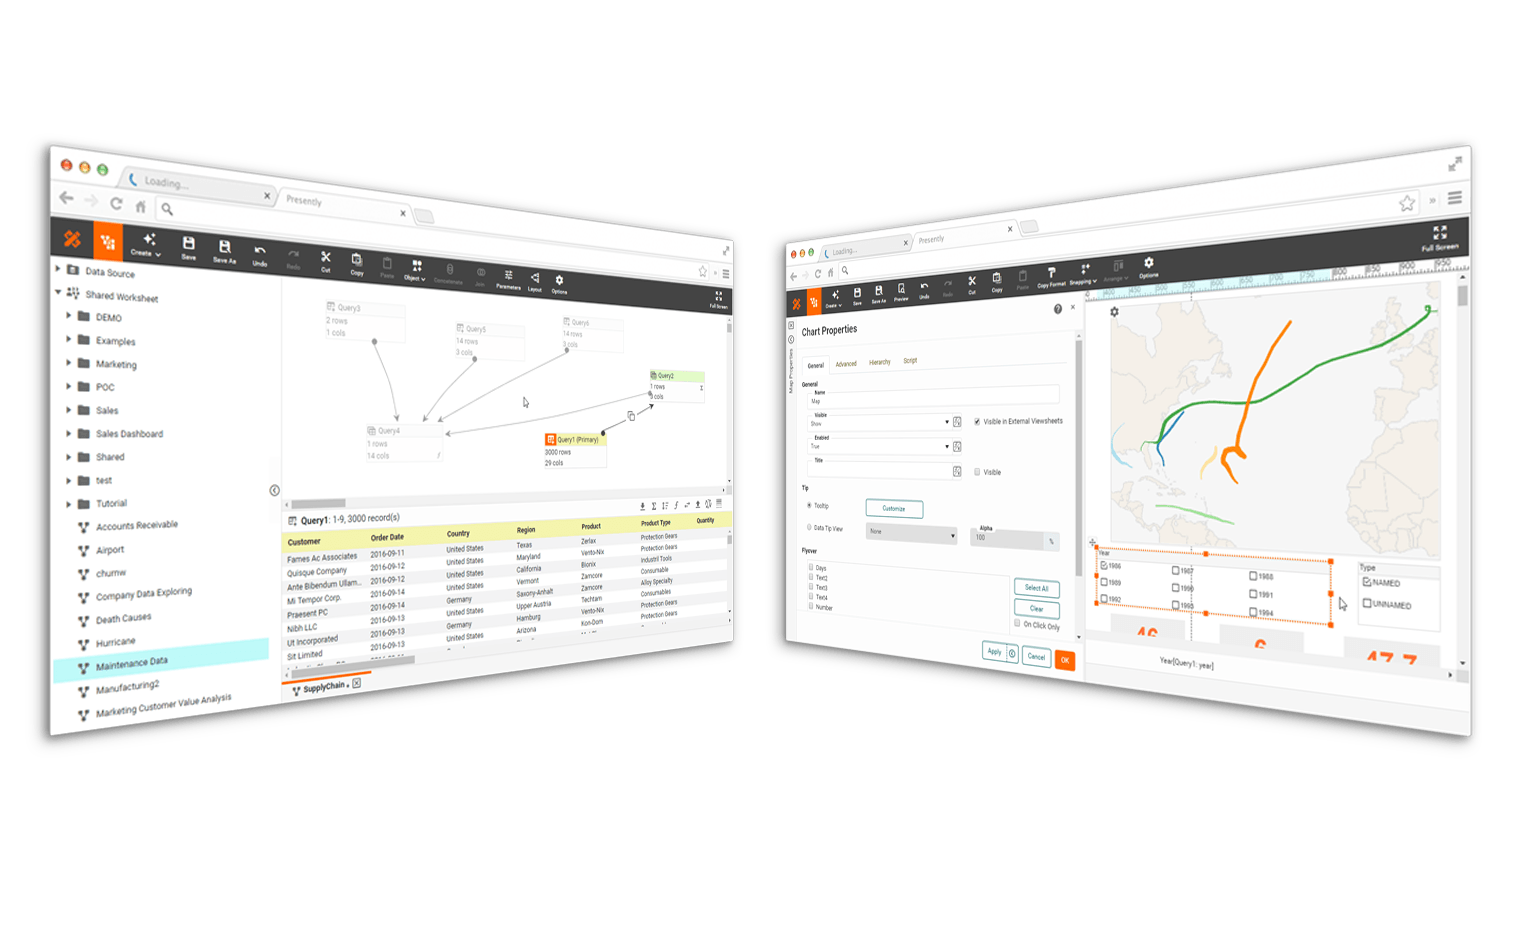
Data Specialists: Mashup Machine Learning with Business Intelligence
What Are the Reasons to Stop Using Crystal Reports?
Certainly, while Crystal Reports has been a stalwart reporting tool for many years, there are several reasons why organizations might consider moving away from it:
- Limited Flexibility in Modern Reporting Needs:
- Crystal Reports was designed primarily for static, structured reporting. However, modern business reporting often requires dynamic, interactive, and visually appealing dashboards and reports. Crystal Reports may struggle to meet these evolving needs.
- Steep Learning Curve:
- Crystal Reports has a reputation for having a steep learning curve. Creating and customizing reports often requires significant training and expertise. This can lead to inefficiencies and slow adoption among users.
- Complexity in Maintaining Reports:
- Maintaining Crystal Reports can be cumbersome, especially as the complexity and volume of reports increase over time. Small changes or updates to reports may require extensive rework, leading to higher maintenance costs and longer turnaround times.
- Compatibility Issues:
- Crystal Reports may face compatibility issues with newer technologies, databases, or operating systems. As organizations upgrade their IT infrastructure, they may encounter challenges in integrating Crystal Reports with their updated systems.
- Limited Support and Updates:
- The level of support and updates for Crystal Reports may not meet the evolving needs of organizations. Delayed bug fixes, lack of new features, and slow response times from support can hinder productivity and innovation.
- High Total Cost of Ownership (TCO):
- While Crystal Reports may have a relatively low upfront cost, the total cost of ownership (TCO) over time can be significant. Costs associated with licensing, maintenance, upgrades, and training can add up, especially for larger organizations.
- Integration Challenges:
- Integrating Crystal Reports with other systems or applications may present challenges, particularly in environments with diverse data sources or cloud-based solutions. Lack of native connectors or APIs can require custom development and increase integration complexity.
- Evolution of Reporting Technologies:
- The reporting and analytics landscape has evolved rapidly, with the emergence of self-service BI tools, cloud-based analytics platforms, and AI-driven reporting solutions. Organizations may find that these newer technologies offer greater agility, scalability, and innovation compared to Crystal Reports.
- Vendor Dependence:
- Organizations relying heavily on Crystal Reports may become overly dependent on a single vendor (SAP). This can pose risks in terms of vendor stability, support continuity, and future development roadmap alignment.
- User Experience and Adoption:
- Crystal Reports' user interface and user experience may feel outdated compared to modern reporting tools. This can impact user satisfaction and adoption rates, particularly among younger, tech-savvy users who are accustomed to intuitive, user-friendly interfaces.
Sample Customers



Company Stories of Selecting InetSoft and StyleBI
How SwapEase Chose InetSoft to Modernize Marketplace Analytics
SwapEase chose InetSoft after struggling with manual aggregation and slow basic reporting. The team needed to combine user, transaction, and support data without constant engineering bottlenecks. InetSoft delivered strong data mashup capabilities and interactive dashboards that non-technical teams could use. Real-time metric customization helped them respond faster to market shifts and fraud signals. As a result, they improved decision speed, visibility, and cross-functional alignment.
Why PrairieLivestock Chose InetSoft Serverless StyleBI for KPIs
PrairieLivestock selected StyleBI to replace fragmented systems and manual livestock reporting processes. They needed scalable analytics that could integrate ERP records, IoT feeds, and operational data. StyleBI's serverless model reduced infrastructure burden while supporting rapid deployment. The company gained clearer monitoring of feed conversion, mortality, and breeding outcomes through role-based dashboards. This improved operational control and enabled faster, data-driven decisions across locations.
Why the Environmental Testing Company Chose InetSoft Analytics
The company moved to InetSoft after facing complexity, slow performance, and low self-service adoption in Sisense. They needed a governed metric layer to standardize turnaround, compliance, and throughput KPIs. InetSoft connected lab, field, ERP, and CRM data in unified views without heavy rework. Non-technical managers gained practical self-service access for site and customer analysis. The migration produced faster insights and more actionable operational dashboards.

Why the Satellite Services Company Chose StyleBI for Operations
The organization chose StyleBI to address inconsistent metric definitions and limited drill-down in its prior environment. It needed multidimensional analysis across regions, ground stations, antennas, and passes. StyleBI's semantic layer created consistent KPI logic for engineering, operations, and leadership teams. Hierarchical overlays and data blending enabled better correlation of telemetry, schedule, and weather factors. This gave teams a faster path from anomaly detection to root-cause action.
Why Orion Chose StyleBI for Forensic Performance Management
Orion adopted StyleBI to replace brittle analytics workflows that slowed case-level performance decisions. They wanted governed metrics with enough flexibility for different forensic practice groups. StyleBI let them standardize KPIs while still supporting scenario exploration by business users. The platform also enabled lifecycle dashboards aligned to how investigations actually move from intake to testimony. Orion gained better visibility, stronger consistency, and faster iteration across teams.
Why HydroForce Chose StyleBI to Raise Team Productivity
HydroForce selected StyleBI to reduce heavy dependence on specialists and spreadsheet-driven operations. The company needed a self-service environment that frontline leaders could use directly. StyleBI made it easier to blend operational, safety, and financial data into one governed model. Dashboard customization and interactivity improved day-to-day visibility for dispatch and maintenance teams. This shift helped accelerate decisions and improve productivity across the business.
Why the Laundry Services Firm Chose StyleBI After Tipboard
The company moved from Tipboard because fragmented scripts and low self-service were limiting growth. They required standardized KPI definitions across plants, routes, and user roles. StyleBI provided a reusable semantic layer plus row-level security for governed access. It also preserved wallboard-style visibility while adding richer interactive analytics. The migration improved scalability, consistency, and operational decision quality.

Why the Company Chose StyleBI for Unified BPM Analytics
Leadership chose StyleBI to unify dashboards, reporting, and performance management in one web platform. They needed stronger self-service so managers could explore data without constant analyst support. StyleBI supported both internal operational visibility and customer-facing analytics from a single environment. Embedded delivery and row-level security made portal use practical for external stakeholders. The result was improved transparency, better KPI governance, and faster insight delivery.
Why SafeQuell Chose StyleBI as Its Dashboard Designer
SafeQuell selected StyleBI after outgrowing a reporting stack that was hard to maintain at scale. The team needed flexible, narrative dashboards for R&D, quality, and regulatory decisions. StyleBI offered stronger parameter controls, responsive layouts, and clearer visual interactions. It also supported exploratory analysis for non-technical users who previously relied on static outputs. This improved collaboration and helped teams act sooner on product and compliance signals.
Why EnviroScrub Chose StyleBI Over Posthog for BI
EnviroScrub chose StyleBI when event-focused analytics could no longer support complex operational reporting needs. They required blended analysis across emissions, maintenance, compliance, and financial datasets. StyleBI provided stronger modeling, governed dashboards, and pixel-perfect reporting for external stakeholders. Non-technical users gained interactive views without query-language dependence. The transition created a more complete intelligence layer for both internal operations and client reporting.
How a Life Sciences RIM Platform Chose InetSoft Embedded BI
The RIM provider selected InetSoft after comparing embedded BI options for regulatory analytics delivery. They needed dashboards to feel native inside their SaaS workflows rather than redirect users elsewhere. InetSoft won on embedding flexibility, scalability, and total cost considerations. The platform also supported self-service needs for regulatory teams with limited technical resources. This improved user experience and made compliance insights more accessible to customers.
How HarmonyTech Switched to InetSoft Reporting Microservices
HarmonyTech switched to InetSoft to replace fragmented data processes and inflexible legacy reporting tools. The company needed real-time analysis, richer customization, and better cross-department visibility. InetSoft microservices enabled role-specific dashboards for leadership, product teams, and operations. Implementation with phased integration and training reduced transition risk while improving adoption. HarmonyTech gained stronger forecasting, faster decisions, and a more scalable analytics foundation.