How to Effectively Present Analytics Data
Presenting web analytics data to executives who have little or no experience data digging themselves can be a challenge for any analyst. There are dozens of metrics in your analytics account- page views, time on a site, unique visitors, cost per click, bounce rate, conversions-the list is endless.
Reports containing all of these metrics are not only confusing but completely worthless. Some metrics in your analytics account will speak loudly to your online marketing team but will mean little to nothing to your CEO. When you communicate with the Big Guns you need to use persuasive presentation skills to make your arguments loud and clear.
You need to make it simple and attractive when you present your data
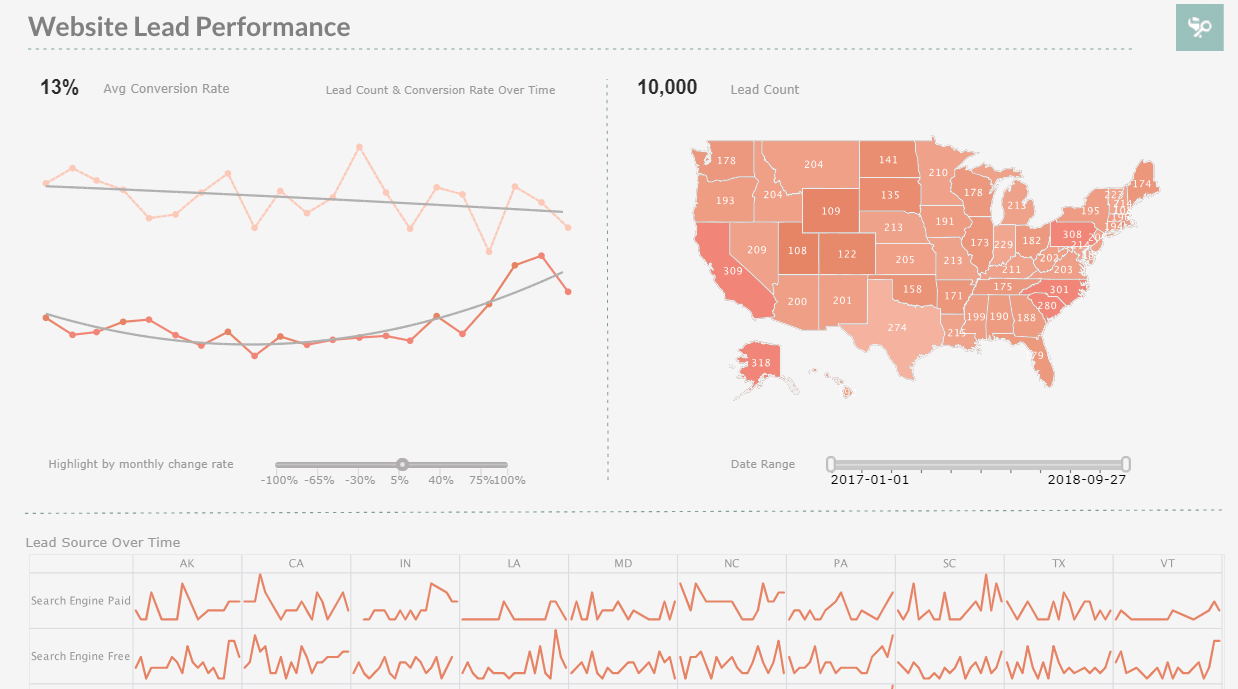
Well devised charts and graphs will help you communicate web analytics data much more easily than spreadsheets. A concise one-page report presenting the essentials like the conversion rate over time for a specific goal or revenue by traffic source will be more powerful than a twenty-page report covering everything in your clients' analytics account. A report displayed on a large LCD screen in the office will attract more attention than a PDF copy of a report viewed on a notebook. You get the idea.
| #1 Ranking: Read how InetSoft was rated #1 for user adoption in G2's user survey-based index | Read More |
Associate Data with Sales, Volume and Market Share
Display data that includes the critical things that tug at the heart strings of your executives to get your message across and get them to take action. You need to create a dashboard that displays all the information your CEO needs-and what they will be interested in depends on a lot of factors. Is it a small, medium or large company? Are they proprietors of an ecommerce site or are they trying to get leads? Does the quality of the lead matter?
Now you need to look at your goals and present your answers to those goals with your analytics data. Maybe you have been working with a client for a month and your goal is to get ahead of the competition for lemon popsicle sales in the first half of the year. It is time to make a graph of lemon popsicle sales in the past year.
Make clear the reasons for the peaks and pits on your graph and offer solutions for how to make the peaks higher and longer in the next year and how to try to eliminate some of the pits. Use your skills to attain information on the successes and failures of your popsicle competition. Examine their data and learn what might work for your CEO, and what experiments you should avoid.
 |
View a 2-minute demonstration of InetSoft's easy, agile, and robust BI software. |
The First Step to Success is to Ask
Before you even start your project you should have a discussion with the people that matter about what the goals of the website are. Those goals should guide your analysis in the first place. If you are confused about the priorities of the CEO of your company, just ask. It will build an open relationship between you so that they trust you have their own personal best interest in your sites when you make site recommendations based on your hard work with the data.
Use Your Creativity
We are data analysts but we are also artists. We need to present content in a way that is both engaging and informative. Doing this is not always easy. If the website you're managing doesn't directly sell products or services – it might be a content site – then relating data to sales or to market share is a big challenge. After you find the appropriate data for the appropriate person in your company, you will need to present it in a compelling way.
While charts and graphs are the most obvious way to present data to your management team, language can be equally persuasive. Scientists, researchers, politicians, and the media are quite good at coming up with persuasive language and analogies. As an online marketer, you are yourself a scientist or researcher of the Web and of websites, and so you can leverage appropriate copy to give merit to the conclusions you have drawn from your analytics data.
 |
View live interactive examples in InetSoft's dashboard and visualization gallery. |
Use the Power of Web Analytics and Mobile Apps
Executives toy all day with their Smartphones. Why not try to bring the essential web Analytics data you want to convey to their Smartphones? Chances are you already use a web analytics system to share data within the company you are working for. You should check whether it's possible for you to deliver your reports straight to your executives' Smartphones. Real time updates will let your executives know you are keeping them involved, and that you yourself are paying close attention to what is going on on their site.


