How Marketers Use Dashboards
Many marketing specialists use dashboards as they help visualize data for easier comprehension and usage.
First of all, it's necessary to define a marketing dashboard. This reporting instrument provides key performance indicators (KPIs) and other metrics in the shape of charts, graphs, and other visual elements. These tools make it possible to evaluate marketing performance objectively. The main question to answer with a marketing dashboard is, "Where are we?" It is possible to correct tasks, set up new goals, and change the schedule using this tool.
The Benefits of Marketing Dashboards
By using a marketing dashboard, you can, for instance, see how far you are in the terms of content. Does your team have enough time to produce and publish the required amount of content? Perhaps, except for your in-house writers and editors, you will need to hire freelance experts from some paper writing service. Another example is whether you have enough social media accounts under your control and how active they are.


Marketing KPIs
A marketing dashboard displays plenty of indicators and metrics that a marketing specialist should know and interpret. Once you have a look at the statuses, you will get an idea of where your project is. The tool allows spotting and fixing issues at the early stages. The idea is to analyze the reports in the shape of heat maps, scatter plots, and other visuals to decide how to improve the current activities and results. Here are some of the metrics provided by most marketing dashboards:
- Lead-to-cashflow
- Prospects
- Profitability
- Conversion rates
- Geodata
- Source tracking (e.g., organic search)
How Does a Marketer at a Fashion Brand Use Dashboards?
A marketer at a fashion brand can leverage dashboards as powerful tools to track, analyze, and optimize various aspects of their marketing efforts. Dashboards provide a visual representation of key performance indicators (KPIs), metrics, and trends, enabling marketers to make data-driven decisions and drive the success of their campaigns. Here's how a marketer at a fashion brand can use dashboards effectively:
-
Campaign Performance Monitoring: Dashboards can aggregate data from various marketing channels such as social media, email marketing, paid advertising, and website analytics. Marketers can track key metrics such as impressions, clicks, conversions, and revenue generated from each campaign in real-time. By visualizing campaign performance metrics on a dashboard, marketers can quickly identify which campaigns are driving the most engagement, sales, and ROI. They can also track the performance of specific marketing channels and campaigns over time, allowing for continuous optimization and refinement of marketing strategies.
-
Audience Segmentation and Analysis: Dashboards can provide insights into the demographics, preferences, and behaviors of the fashion brand's target audience. Marketers can segment their audience based on factors such as age, gender, location, interests, and purchase history. By visualizing audience data on a dashboard, marketers can identify trends, patterns, and opportunities to tailor their marketing messages and promotions to specific audience segments. This personalized approach can lead to higher engagement, conversion rates, and customer loyalty.
-
Inventory and Sales Monitoring: Dashboards can integrate data from inventory management systems and sales databases to provide real-time visibility into product availability, sales performance, and inventory levels. Marketers can track sales trends, monitor product performance, and identify which products are selling well and which ones are underperforming. By visualizing inventory and sales data on a dashboard, marketers can make informed decisions about inventory replenishment, pricing strategies, and promotional activities. They can also identify opportunities to cross-sell or upsell complementary products based on customer purchase behavior.

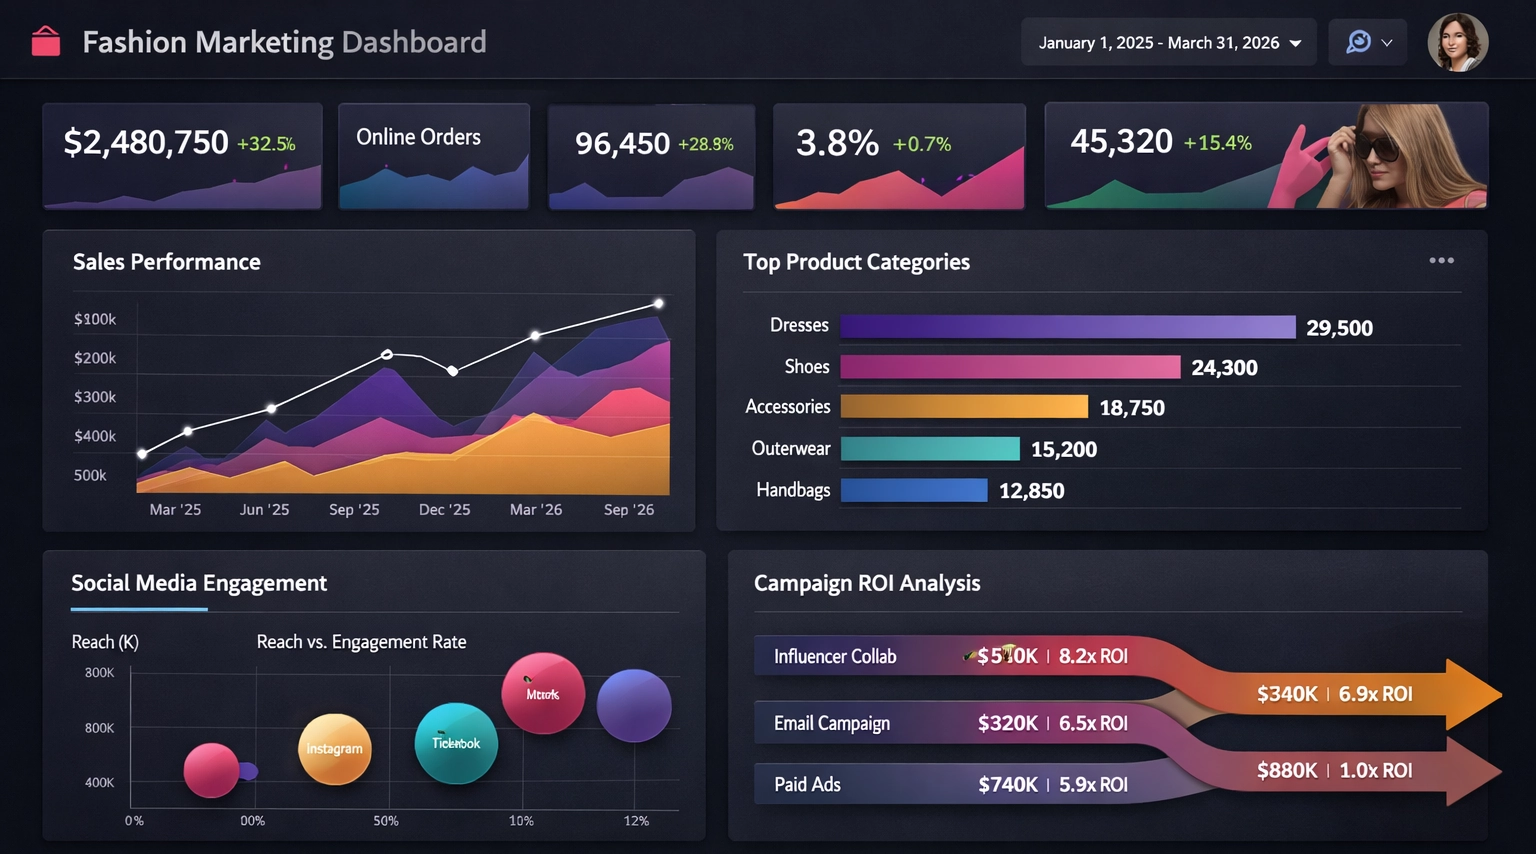
Fashion Market KPIs and Metrics to Track
Fashion marketing teams work in a fast cycle where trends, seasons, and inventory turnover can change quickly. A dashboard for the fashion market should combine brand awareness metrics, ecommerce conversion metrics, and merchandising performance indicators in one place. Tracking these KPIs consistently helps marketers react to demand shifts, reduce markdown pressure, and maximize campaign return.
- Sell-through rate by collection, category, and size curve
- Full-price sell-through vs. markdown sell-through
- Average order value (AOV) and units per transaction
- Cart abandonment rate by traffic source and device type
- Customer acquisition cost (CAC) by channel and campaign
- Return rate by product type, fit profile, and region
- Repeat purchase rate and time between purchases
- Email and SMS revenue per send, plus unsubscribe rates
- Influencer campaign engagement rate and attributed revenue
- New arrivals performance in the first 7, 14, and 30 days
- Gross margin after discounts, returns, and fulfillment costs
- Inventory aging and weeks of cover for core SKUs
For fashion brands, these metrics are most useful when segmented by season, channel, audience cohort, and product family. For example, comparing conversion and return rates for the same style across social traffic, paid search, and email can reveal whether a problem is product-market fit, creative messaging, or onsite experience. This level of visibility helps teams optimize media spend, improve product storytelling, and align inventory planning with real customer demand.

Recommended Fashion Marketing Dashboard Layout
A practical setup is to organize the dashboard into three tabs so leaders and specialists can move from strategy to action in seconds:
- Executive Overview: Include total revenue, full-price sell-through, gross margin, customer acquisition cost, and repeat purchase rate, plus a week-over-week trend summary.
- Performance Marketing: Track channel-level spend, ROAS, conversion rate, cart abandonment, influencer attribution, and new customer share by campaign.
- Merchandising and Inventory: Monitor SKU velocity, size-level sell-through, markdown dependency, return rate by style, and aging inventory to support pricing and replenishment decisions.
This structure gives executives a quick health check while giving campaign and merchandising teams enough operational detail to act immediately.