Metrics to Monitor on Your SEO Dashboard
There are practically unlimited parameters you may monitor when gauging the effectiveness of your SEO strategy or performing an SEO audit.
Here are the top nine SEO metrics and how to track them to assist you in focusing on the proper metrics, regardless of the nature of your organization. Key performance indicators for SEO are essential for a company that expands consistently.

Organic Traffic
Let's begin with the most obvious. The traffic you receive from search engine results pages (SERPs) without having to pay for ad placement is known as organic traffic. Narrowing your emphasis to organic traffic demonstrates your website's presence in search for terms related to your business. Your overall traffic may come from a variety of sources (search engines, social networks, direct searches, and other sites). Therefore, if your SEO approach is effective, you should see a consistent increase in the number of visitors coming through search results.
Click-through Rate (CTR)
The percentage of individuals who visit your website after finding it through the SERPs is indicated by your organic click-through rate. Therefore, your page's CTR is 10% if 1,000 users see it listed in the search results and 100 of them click through to visit your website. Organic CTR demonstrates how well your listing (including the title, meta description, and URL) appeals to and engages your audience. If your CTR is poor, your title or meta description may not be compelling, or the content may not be pertinent to the user's search.
Exit Rate
Exit pages are, as the name implies, the last pages that visitors see before leaving your website. The most popular exit pages on your website are the ones that cause visitors to lose interest and leave. It's crucial to monitor your top departure pages because these are the sections of your website where most people leave. Therefore, it may indicate that the page or its content needs improvement if you notice that a significant portion of your traffic drops off after visiting a particular page.
You can do the following to lower your pages' exit rate:
- Make the page design and content organization simple to understand.
- Include calls to action and clear internal links to direct readers to other pages and content that is pertinent to them.
- To better engage visitors, add high-quality information that also includes visuals pictures, and video.

Number of Pages Per Session
Pages per session, a crucial indicator of user engagement on your site, show how many pages on average each user views before leaving. This measure should be as high as possible because it indicates that users are exploring more pages and staying on the site longer. If this score is low, it can be a sign that your material isn't interesting or enough to encourage people to browse further sites. Or it could suggest that the navigation on your website is not user-friendly.
Page Load Time
Your site speed is a crucial SEO ranking criterion that may make or break your rankings (and user experience), both for desktop and mobile. It also checks the load time of the image. If an image is less than 800*600 then the load time of the image will decrease.
Back-links and Domains
One of the most important ranking factors on Google is the number of backlinks. Additionally, a recent analysis of over 11 million Google search results shows that ranks and the quantity of referring domains are strongly correlated. Referring domains are the number of distinct domains from which you have incoming links, whereas back-links are the total number of links pointing from outside sources to your website.
Keyword Rankings
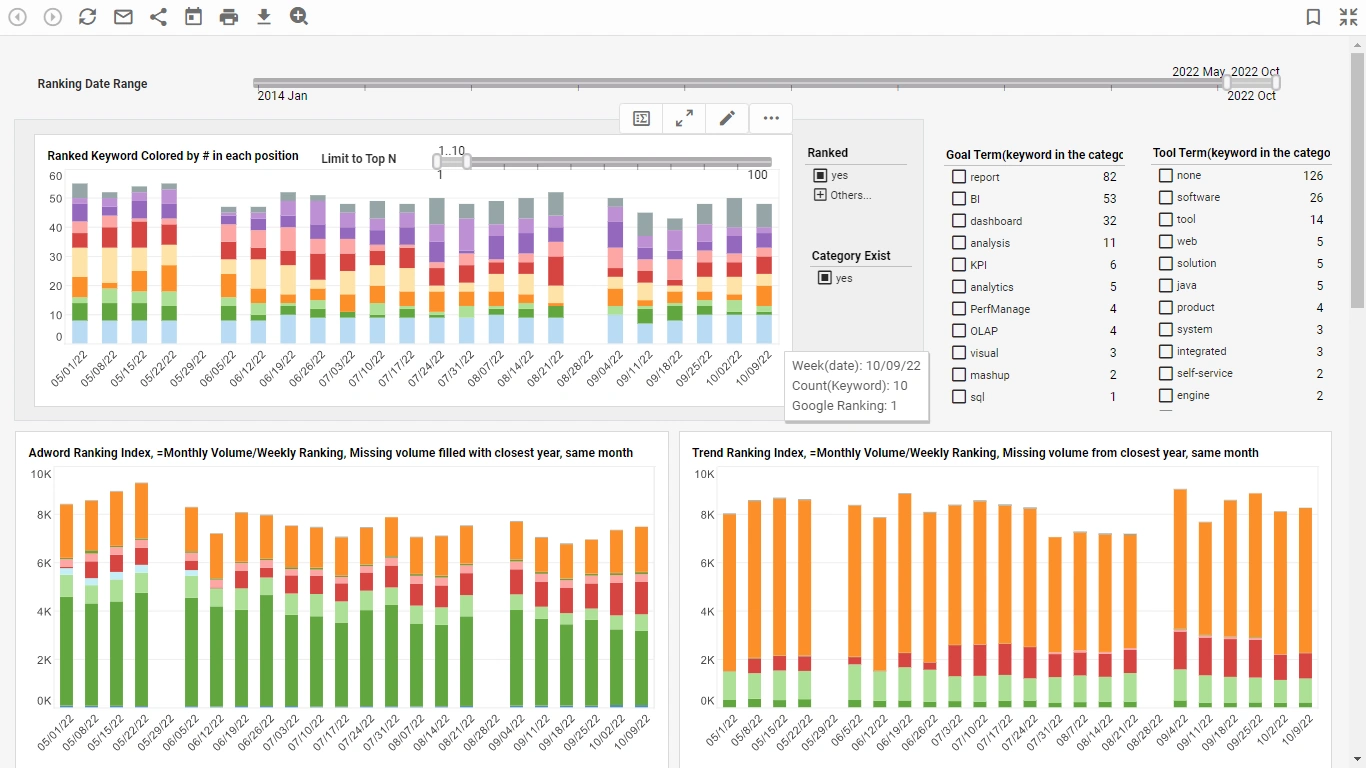
Monitoring how your rankings for those keywords change is a smart idea as you work on optimizing your website to rank for your target keywords. Knowing the keywords you are now ranking for helps you gauge your current share of organic search visibility, which helps you choose whether to concentrate on further optimizing for those keywords or on other phrases you want to rank for but haven't yet. Tools can be used to monitor the rankings of your keywords. Some other tools can be used to monitor how your keywords are performing. You can track ranking changes over time and observe how your total search visibility is increasing by using the Organic Search Positions report.

Ranking Index
Download your keyword rankings each week and save into a spreadsheet. Find the seach volumes for the keywords. Create a formula dividing the volume by the ranking. Add up the calculations across all the keywords. Watching how this total increases or decreases gives you an overall understanding of the improvements or drops in performance weighted by their importance on your website traffic.
Organic Conversion Rate
While traffic and rankings are important, the ultimate goal of SEO is to drive business outcomes. Organic conversion rate measures the percentage of visitors from search engines who complete a desired action, such as filling out a form, requesting a demo, or making a purchase. Tracking this metric helps you understand how well your content and landing pages turn search visibility into tangible results. If organic conversions are low despite strong traffic, you may need to refine your offers, calls to action, or on-page messaging.
Bounce Rate from Organic Traffic
Bounce rate indicates the percentage of visitors who land on a page and leave without viewing any other pages. When filtered to only organic sessions, it becomes a powerful indicator of how well your pages satisfy search intent. A high bounce rate can signal mismatched keywords, weak content, or poor user experience. Monitoring bounce rate by landing page and keyword allows you to identify which topics or pages need better alignment with what searchers expect to find.
Core Web Vitals (Page Experience)
Core Web Vitals are a set of user experience metrics that Google uses as ranking signals. They focus on loading performance, interactivity, and visual stability. Examples include Largest Contentful Paint (LCP), First Input Delay (FID), and Cumulative Layout Shift (CLS). Tracking these metrics on your SEO dashboard helps you spot technical issues that may hurt both rankings and user satisfaction. Improving Core Web Vitals often leads to faster pages, smoother interactions, and better engagement from organic visitors.

Mobile Friendliness and Mobile Organic Traffic
With most searches now happening on mobile devices, it’s critical to monitor how your site performs for mobile users. Mobile friendliness includes responsive design, readable text, tap-friendly buttons, and fast load times on phones and tablets. On your SEO dashboard, segment organic traffic by device type and track metrics such as mobile sessions, mobile bounce rate, and mobile conversion rate. If performance on mobile lags behind desktop, prioritizing mobile UX improvements can significantly boost overall SEO effectiveness.
Index Coverage and Crawl Errors
Search engines can only rank pages they can crawl and index. Index coverage reports show which URLs are successfully indexed and which are excluded due to errors or directives. Common issues include 404 pages, server errors, and blocked resources. By monitoring index coverage and crawl errors, you ensure that your most important content is accessible to search engines. Fixing these issues can quickly improve visibility, especially for pages that were unintentionally omitted from the index.
Branded vs. Non-Branded Organic Traffic
Not all organic traffic is equal. Branded traffic comes from searches that include your company or product name, while non-branded traffic comes from generic queries related to your offerings. Separating these two on your SEO dashboard helps you understand whether growth is driven by brand awareness or by broader keyword visibility. Increasing non-branded traffic typically indicates successful content and keyword strategies that reach new audiences, while branded traffic reflects the strength of your reputation and offline marketing.
About the Article Contributor: This helpful advice comes from SEO expert, Online Marketing. Consider exploring SEO packages in Dubai to enhance your website's performance and improve your search engine rankings.