Real-time Monitoring and Alerting for Java Applications
Java's ease of use and cross-platform compatibility make it a go-to choice for developers, ensuring high-performance standards for critical web applications requires effective Java performance monitoring practices. However, the challenges of poor application performance can be a major headache for developers and IT managers.
Enter real-time monitoring and alerting. It helps developers measure performance and detect issues that may impact user experience. This article explores the real-time monitoring and alerting for Java applications:
- What is real-time monitoring and alerting in Java applications
- Why is it important for your Java applications?
- How you can use it to improve your application performance
- Tips for developing a solid monitoring plan


How Is Real-Time Monitoring and Alerting Done?
Real-time monitoring and alerting for Java applications involve continuously tracking and analyzing the performance of Java-based applications in real-time. Java application monitoring software, like Middleware offers a range of features, including:
- End-to-end tracing, infrastructure metrics
- Customizable dashboards
- Real-time alerts
Whether you're dealing with slow database calls, JVM memory issues, or thread deadlocks, monitoring and alerting Java applications will always enable you to resolve issues quickly and efficiently. In order to understand how real-time monitoring and alerting works, let's take a dummy Java application and monitor its performance. We should first install the Java APM and configure it.
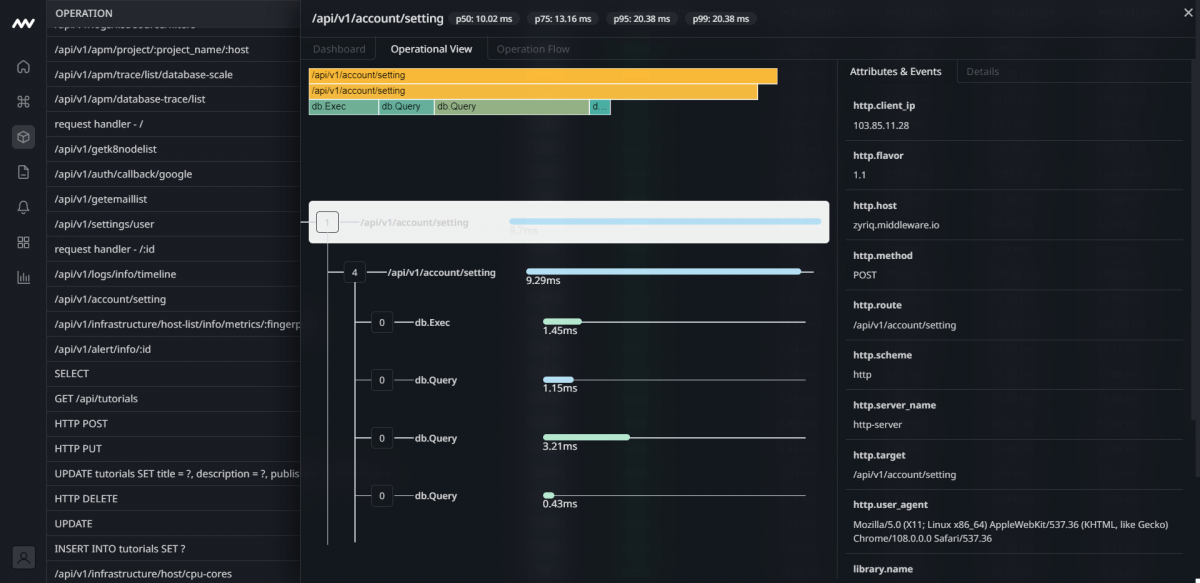
Many monitoring software applications have customized OTEL Java Instrumentation projects, by using its extension feature, allowing it to support libraries and frameworks like Apache Kafka, AWS lambda, Apache Dubbo, Azure core, and other popular libraries and frameworks. Once we are in the dashboard, we will be able to see some essential metrics like trace status, latency, and total hits. The tool will also provide us with a detailed view of each trace:

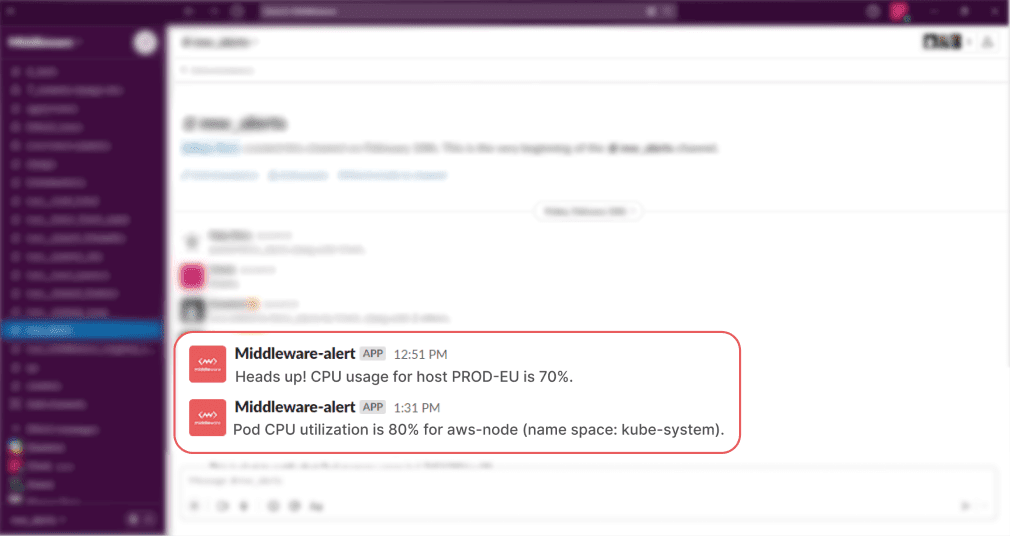
Apart from that, when latency for the test app drops or when the CPU usage increase too much, we will be alerted in Slack by the application alerting system which we configured during the dashboard setup process:
Why is Monitoring Java Applications Important?
Monitoring your Java application's performance is crucial for multiple reasons. Let's have a look at it:
1. User Experience
Java is a widely-used in multiple industries across the world. Hence, poorly performing apps can lead to multiple downtimes and eventually frustrate the users. This has a negative impact on customer experience. It results in decreased user satisfaction and a potential loss of business. Therefore, it becomes essential to monitor your Java applications and optimize them to ensure peak performance.
2. Productivity
Slow-running Java applications can lead to decreased productivity among your development teams. Your teams would end up spending more time debugging and fixing issues than actually developing new features.
3. Cost
Inefficient Java applications can be costly to run. Increased infrastructure and maintenance costs will eat into your bottom line. Optimizing your Java applications can help reduce costs and improve efficiency.
4. Scalability
As your business grows, your applications should grow too. They must be able to meet the increased demands. Poor performance can limit your ability to scale and it would eventually lead to missed opportunities for growth. This is why optimizing your Java applications to meet your scalability needs is a must!
5. Competitiveness
Poor performance can lead to a loss of market share to competitors who have better-performing applications than yours. By constantly monitoring and optimizing your Java applications, you can maintain a competitive edge in your industry.
5 Ways to Improve Your Java Application's Performance
Improving Java application performance requires a multi-faceted approach. But here are some things to do:
1. Avoid Recursion
In Java, recursion is not a very cost-effective operation compared to iterative solutions using loops. It might be appropriate for some circumstances. But for most cases, make sure you opt for iterative solutions.
2. Use StringBuilder
Instead of repeatedly using the += operator to concatenate strings, which is inefficient due to the creation of new String objects, use StringBuilder or StringBuffer. StringBuilder is the preferred choice since it's faster than StringBuffer due to the absence of thread synchronization.
3. Use Stack Allocations
Java applications store their data in two memory structures: the heap and the stack. Use primitive types and local variables to implicitly ensure that the JVM uses the stack instead of the heap. This is important because items and variables on the stack are quicker to access and use.
4. Tune the JVM
The JVM is the engine that runs Java applications. It is responsible for:
- Managing memory
- Running the garbage collector
- And executing Java bytecode
The JVM has multiple configuration options that you can tune to optimize performance. One such option is to modify the size of the heap and the garbage collector to decrease the frequency of garbage collection pauses.
5. Choose the Right Garbage Collector
Choosing the right garbage collector for your Java application is crucial. It should be based on the specific needs of your software.
For example:
- You can select the Serial Collector option for single-threaded software that can withstand unexpected pauses.
- On the contrary, the Concurrent Mark Sweep (CMS) collector is suitable for applications that prioritize low pause times, high throughput, and ample memory. It performs garbage collection concurrently with the application's execution to minimize pauses.
How to Develop a Solid Monitoring Plan for Your Java Applications
It's crucial to have a solid monitoring plan in place to proactively identify and resolve issues before they become critical.Keep an eye on the following two types of metrics:
- Metrics related to the Java Virtual Machine (JVM),
- Infrastructure status levels
JVM metrics will give you insights into the performance, speed, and reliability of your Java application. On the other hand, monitoring infra metrics can reveal issues with your hardware, network, and other infrastructure components. For example, you might track CPU usage, disk space, or network latency to identify potential failure.

Specific Metrics for Java Apps
Let's talk about some of the specific metrics to consider in detail.
1. Java Heap Memory Usage
When the JVM begins to function, it creates a heap memory. Any object in the heap can be shared between threads when the application is running.
The heap memory usage will tell you how much of your JVM memory is currently in use. A consistently high heap usage may be a sign of a memory leak or inefficient memory usage.
2. Garbage Collection Activity
The JVM runs a garbage collector to free up memory that is no longer in use periodically. Monitoring garbage collection activity will help you identify performance issues related to garbage collection, such as:
- Long pause times
- Excessive memory usage
3. Key Infrastructure Metrics
Aside from observing the JVM metrics, it is crucial to monitor the fundamental infrastructure that sustains your Java applications. This includes monitoring:
- Server CPU and memory usage
- Network traffic
- Disk I/O
This helps detect problems with system resources, such as overloaded servers, network congestion, or disk bottlenecks. Other metrics relevant to infrastructure include:
- Open File Descriptors
- Database Connections
- SLA
- The success of API Endpoints
- Latency
- Errors and Exceptions
- Health and Status of Dependencies
4. CPU Usage
Java applications can be CPU-intensive. Especially if they are processing large volumes of data or performing complex computations. Monitoring CPU usage can help identify performance bottlenecks, such as:
- Inefficient algorithms
- Resource-intensive background tasks
5. Active Threads
Threads play a crucial role in the task processing of applications. However, multiple threads operating simultaneously can negatively impact the performance of your Java applications. Hence, it is essential to keep track of the active threads in your Java applications and make certain that there is no excessive concurrent thread execution.
6. Response Time
You would expect your computer applications to perform tasks efficiently. One way to measure this is by checking the application's response time. It'll tell you how quickly your applications are responding to requests.By keeping track of this metric over time, you can establish a performance baseline. Any significant deviation from this baseline can be a sign of trouble.