Maximum Self-Service for Business and Technical Users
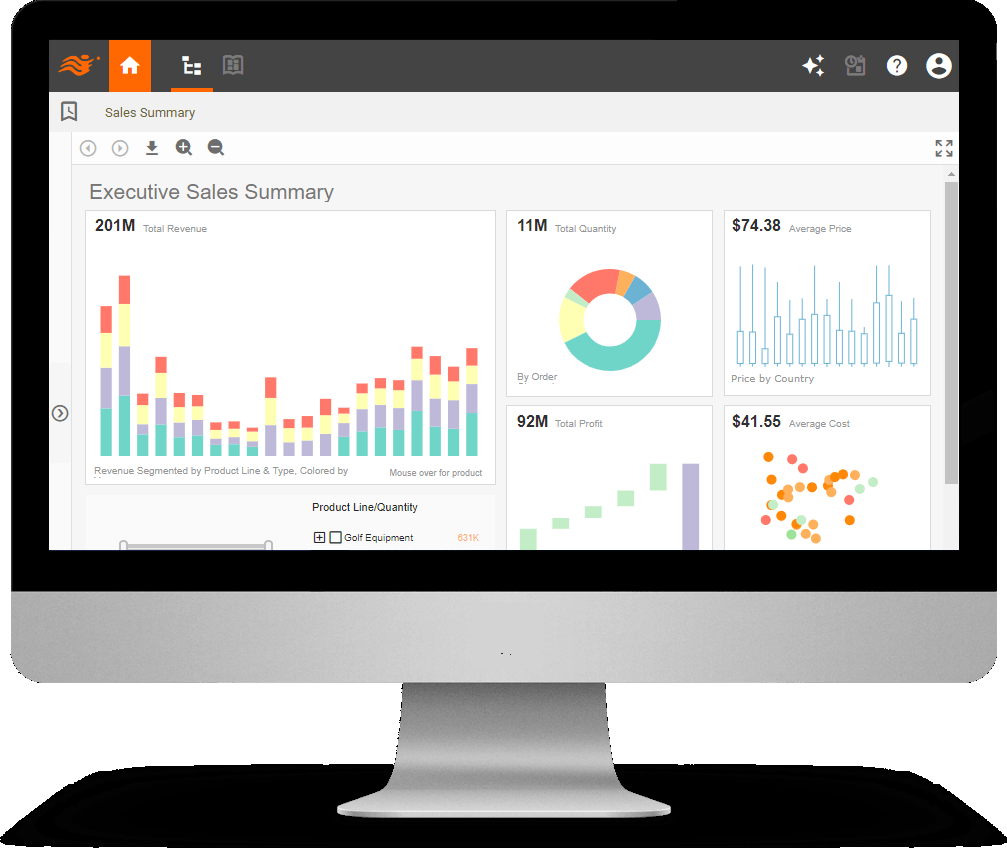
Real-Time Monitoring and Analytical Dashboards
Powered by a Data Transformation and Mashup Engine
Award winning, trusted by 5,000+ customers since 1996


Free start:
Open source StyleBI is free to use
Free account for StyleBI Online Application
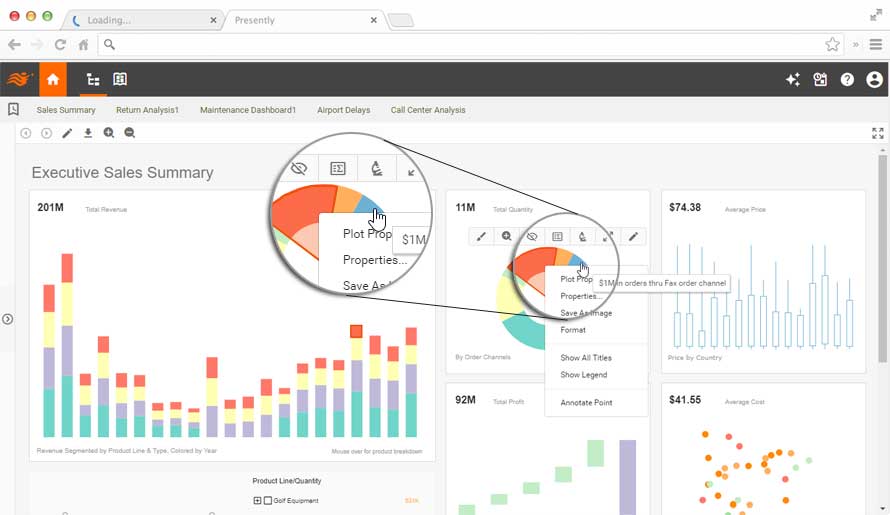
Business Users: Interactive Dashboards with Rich Customization and Self-Service
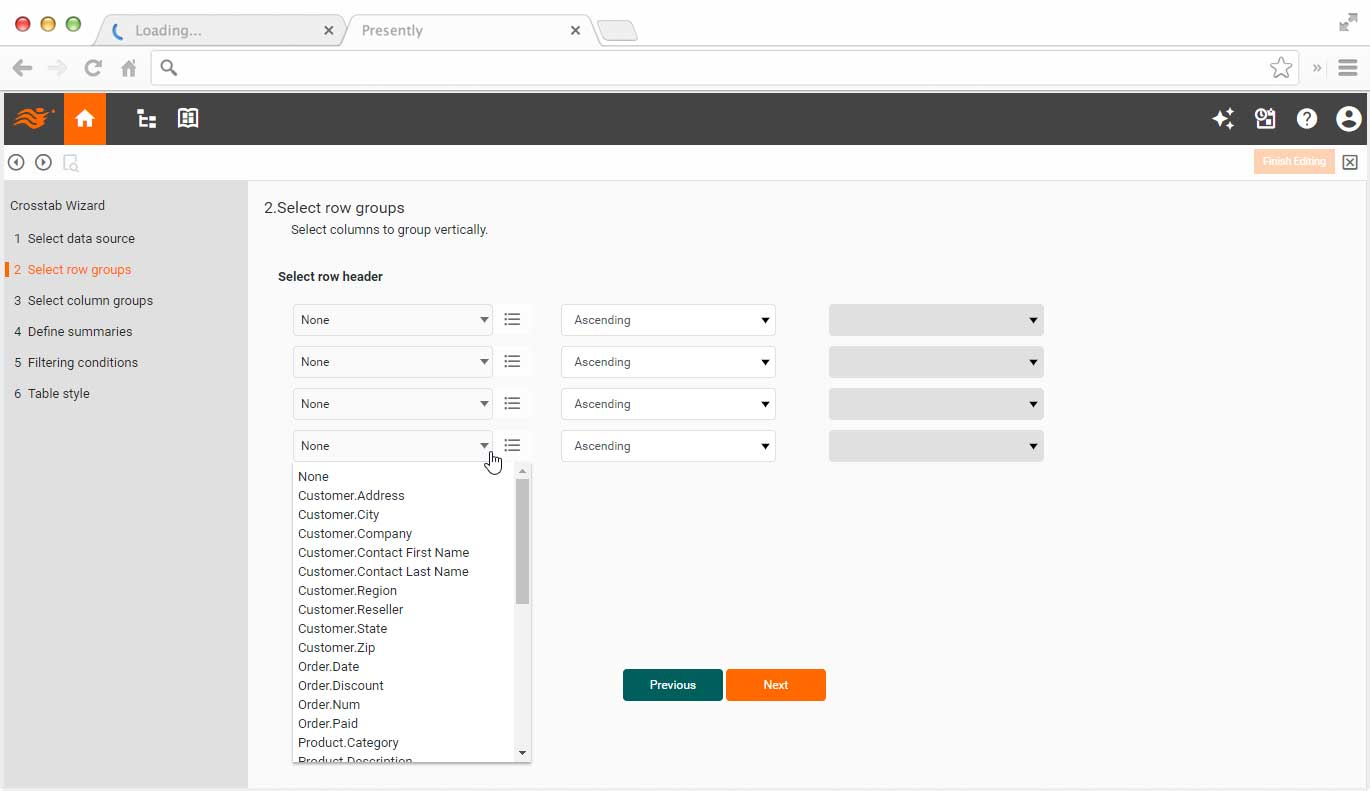
Designers: Rapidly Prepare Data and Design Dashboard Reports
Sample Customers











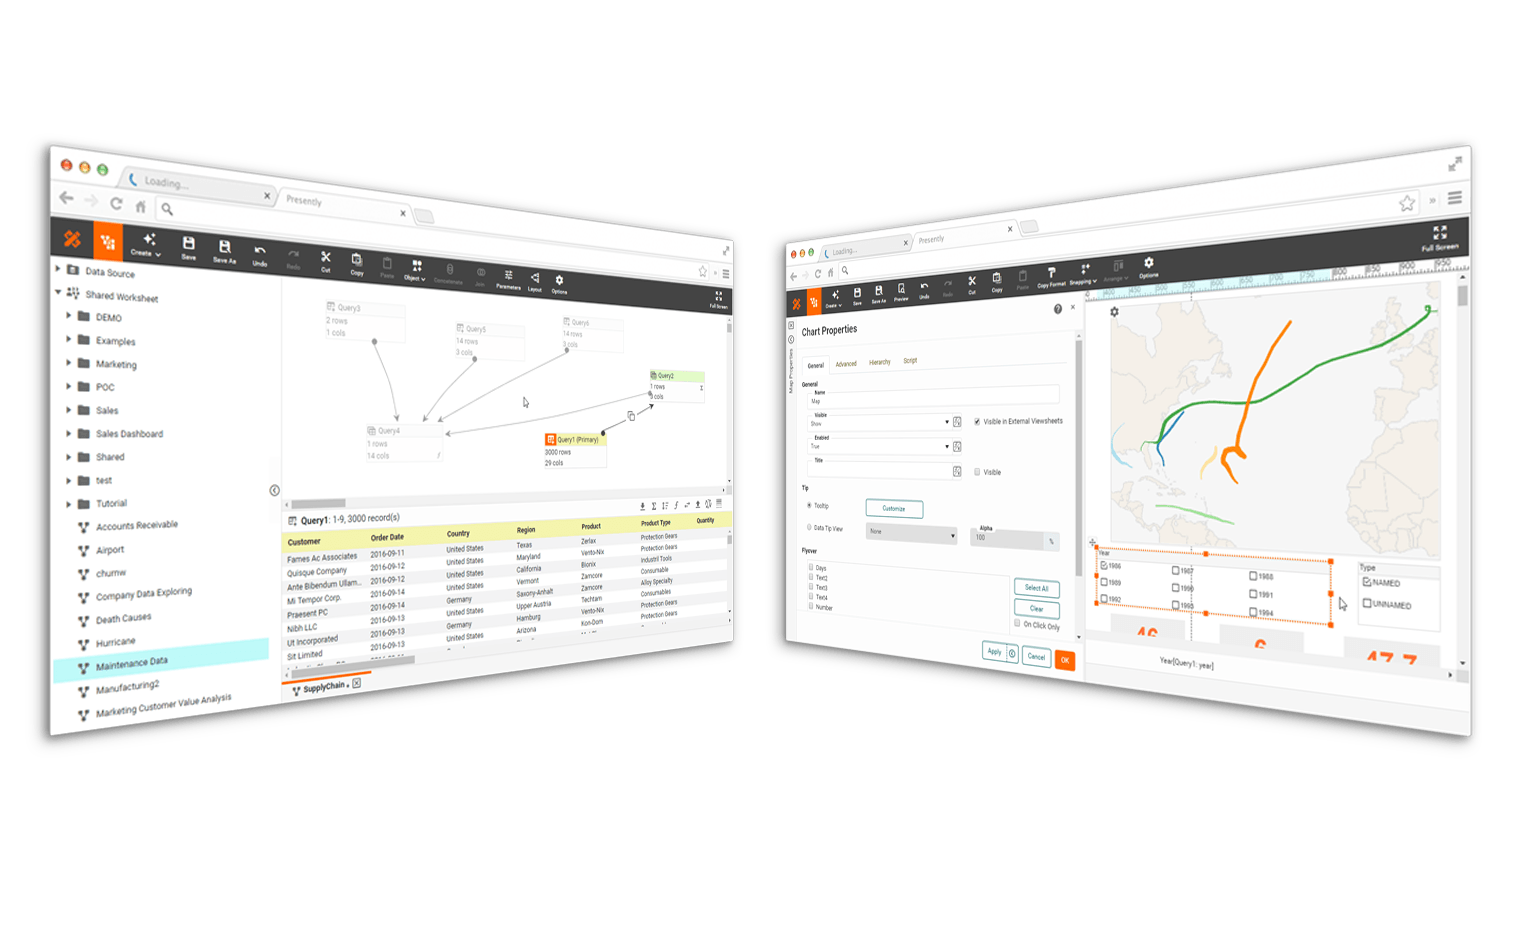
Data Specialists: Mashup Machine Learning with Business Intelligence

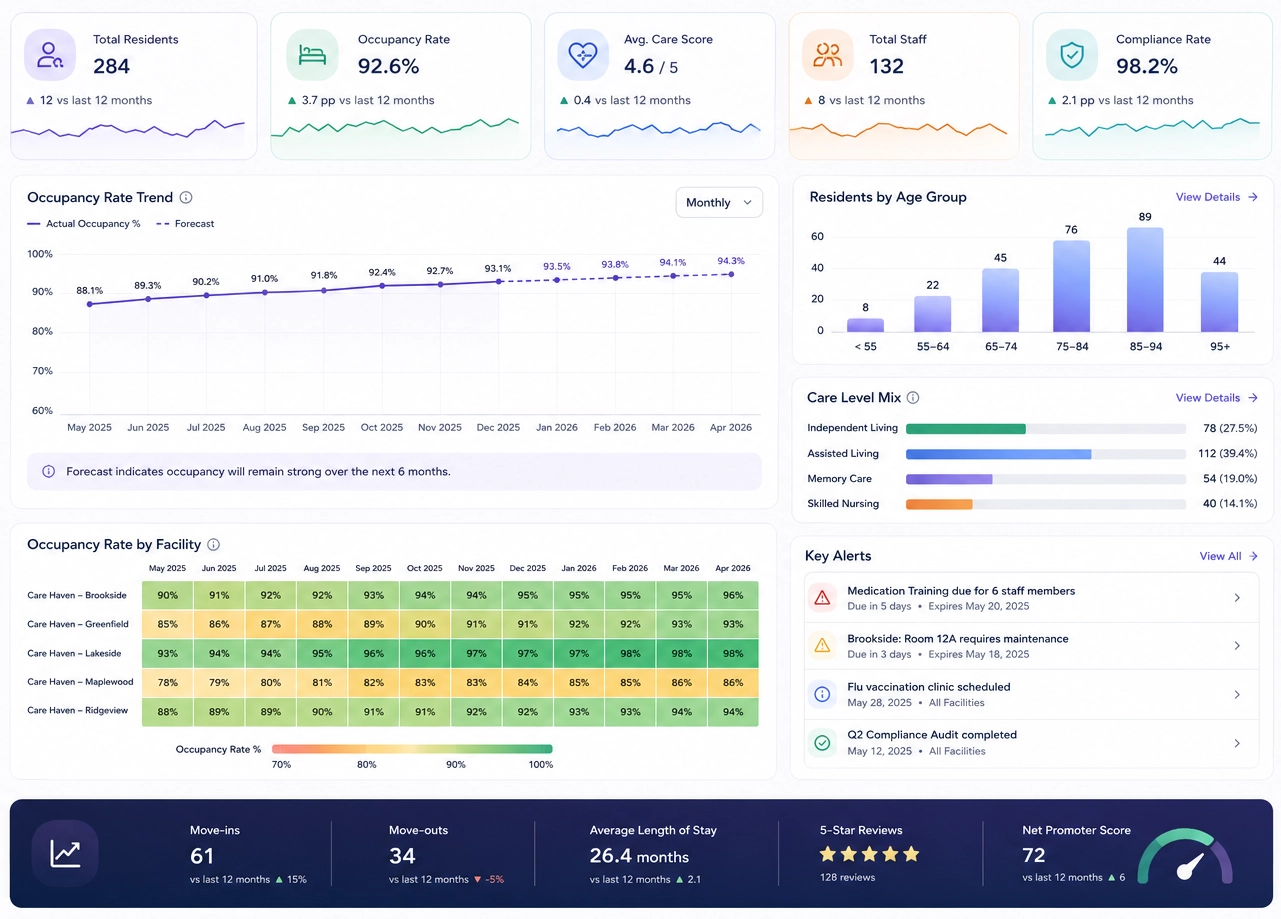
How Do Operators of Nursing and Residential Care Facilities Use Business Intelligence?
Business intelligence encompasses the processes, technologies, and strategies used to analyze and interpret data to support decision-making. In the context of nursing and residential care facilities, BI tools are employed to gain insights into various aspects of operations, including resident care, staffing, financial management, and regulatory compliance.
-
Resident Care Optimization: BI enables operators to monitor and analyze data related to resident health outcomes, satisfaction levels, and service utilization patterns. By tracking metrics such as medication adherence rates, incidence of falls, and hospital readmission rates, operators can identify areas for improvement and implement targeted interventions to enhance the quality of care delivered to residents.
-
Staffing Management: Effective staffing is essential for ensuring resident safety, satisfaction, and quality of care. BI tools allow operators to analyze staffing levels, staff-to-resident ratios, and employee turnover rates to optimize workforce allocation and scheduling. By identifying staffing shortages or overages in real-time, operators can adjust staffing levels accordingly to maintain optimal care standards while controlling labor costs.
-
Financial Performance Monitoring: Nursing and residential care facilities operate within tight budget constraints, making financial management a top priority. BI solutions facilitate the analysis of revenue streams, expenditure patterns, and billing processes to improve financial performance and profitability. Operators track metrics such as revenue per resident day, average length of stay, and accounts receivable aging to identify revenue opportunities, reduce costs, and enhance cash flow.
-
Regulatory Compliance: Compliance with regulatory requirements is critical for nursing and residential care facilities to maintain licensure and accreditation. BI tools enable operators to track compliance metrics, such as staff training certifications, documentation completeness, and survey outcomes, to ensure adherence to regulatory standards. By proactively identifying areas of non-compliance, operators can implement corrective actions and mitigate risks of penalties or sanctions.
Key Metrics and KPIs Tracked by Operators:
Operators of nursing and residential care facilities track a variety of metrics and KPIs to assess performance, drive improvement initiatives, and achieve organizational objectives. Some of the key metrics and KPIs commonly monitored include:
-
Occupancy Rate: The percentage of available beds or units that are occupied by residents. A high occupancy rate indicates strong demand for services and optimal utilization of facility resources.
-
Average Length of Stay: The average duration of time that residents stay in the facility before discharge or transfer. Monitoring this metric helps operators understand resident turnover rates and plan for capacity management.
-
Staff Turnover Rate: The percentage of employees who leave their positions within a specified period. High staff turnover can negatively impact continuity of care, morale, and operational efficiency.
-
Medication Error Rate: The frequency of errors or discrepancies in medication administration documented through incident reports or quality audits. Minimizing medication errors is crucial for resident safety and regulatory compliance.
-
Patient Satisfaction Scores: Feedback from residents and their families regarding their experiences with care services, amenities, and overall satisfaction. Improving patient satisfaction scores enhances resident retention and reputation management.
-
Revenue per Resident Day: The average revenue generated per resident per day of stay, calculated by dividing total revenue by total resident days. Increasing revenue per resident day contributes to financial sustainability and profitability.
-
Staffing Ratio: The ratio of staff members to residents, typically measured for different shifts and care units. Maintaining appropriate staffing ratios ensures adequate supervision, assistance, and support for residents' needs.
More Customer Stories of Teams Switching to InetSoft and StyleBI
How a Feldspar Miner Switched from Adobe Analytics to InetSoft’s Serverless Analytics Microservice
The mining team moved because a web-analytics-first stack could not model plant telemetry, logistics, and operational KPIs together. They needed dashboards that blended historian feeds, ERP data, and shift-level metrics in near real time. InetSoft’s serverless microservice architecture scaled with workload spikes without heavy infrastructure overhead. Embedded delivery made analytics easier to consume inside existing operational tools. The result was faster decisions, lower support burden, and measurable improvements in cost control and user satisfaction.
Why an Industrial Gas Supplier Switched from Grafana to InetSoft's Serverless Dashboard Microservice
The supplier outgrew a monitoring-only approach and needed broader business and operational intelligence. Grafana sprawl and plugin maintenance created governance and support friction across global teams. InetSoft reduced infrastructure management with elastic serverless deployment and centralized dashboard standards. The company also gained stronger cost predictability as usage scaled across regions. Teams received clearer cross-functional visibility into uptime, logistics, and incident performance.
Rare Earth Metal Recycler Switched From Databox to InetSoft for a Performance Measurement Solution
The recycler switched because generic scorecarding could not capture its complex process and compliance metrics. It needed one platform for IoT sensor data, ERP records, and environmental reporting feeds. InetSoft provided live data mashups that exposed yield, quality, and emissions trends in a unified view. Role-based dashboards helped operators and executives act from the same trusted KPI definitions. The company reduced reporting overhead and improved both operational responsiveness and regulatory confidence.

How an Aramid Fiber Recycler Switched From Zoho to InetSoft for Reporting Needs
The recycler moved from Zoho when static extracts and lagging refresh cycles slowed plant-level decisions. It needed high-performance analysis across MES, LIMS, procurement, and compliance data sources. InetSoft’s mashup layer and caching improved responsiveness for traceability and quality investigations. Security controls supported separate views for vendors, QA teams, and leadership without duplicating reports. The migration improved throughput, reduced rework, and made reporting far more actionable.
How An Attapulgite Clay Processor Switched From Wrike To InetSoft For Performance Measurement Needs
Wrike helped with tasks, but it could not deliver the specialized analytics needed for mineral processing operations. The processor required live joins across LIMS, MES, procurement, and quality certificates. InetSoft standardized metric logic and delivered plant-relevant dashboards with faster load times. Engineers could test process changes within a shift instead of waiting for end-of-day reporting. The switch cut waste, tightened process control, and improved measurement-driven execution.
How an Industrial Textile Recycler Switched from Wrike to StyleBI for Project Reporting
The company needed project reporting that went beyond task tracking into supply chain, compliance, and margin analysis. Wrike could organize work, but deeper multi-source analytics required too much manual effort. StyleBI provided a stronger semantic model and interactive dashboards for cross-functional project visibility. Teams gained drill-down analysis on performance trends across contracts, timelines, and resource use. This improved planning accuracy and helped leadership make better strategic project decisions.
How a Damask Textile Manufacturer Switched from Teamwork.com to StyleBI
The manufacturer switched because conventional project status reports could not reflect complex artisan production realities. It needed deeper insight into loom utilization, rework impacts, and delivery risk by order type. StyleBI enabled richer mashups across operations, finance, and procurement data. Managers gained real-time status visibility instead of relying on static periodic summaries. The transition improved cross-department coordination and reduced surprises in high-value customer projects.

How a Decorative Concrete Manufacturer Switched from Metabase to StyleBI
The manufacturer outgrew Metabase as its data and forecasting needs became more sophisticated. It needed stronger support for complex, multi-source analysis across production, quality, and customer outcomes. StyleBI offered richer mashup capabilities and interactive exploration for non-technical stakeholders. This enabled teams to detect bottlenecks and trend shifts earlier in the production cycle. The move increased analytical depth and improved execution across operations and planning.
How A Diamond Tool Manufacturer Switched From Zoho Analytics to StyleBI
The company switched when Zoho became limiting for large, globally distributed manufacturing and sales datasets. It needed better integration with specialized production and supply-chain systems. StyleBI handled deeper analysis while keeping dashboards usable for business teams. The platform improved correlation between quality, cost, logistics, and demand signals. As a result, decisions became faster and more consistent across regions and departments.
How a Sand Dune Stabilizer Switched from Microsoft Report Builder to InetSoft
The firm moved from static report generation to support broader environmental project analytics. It had to combine field measurements, drone data, weather patterns, and stakeholder reporting in one place. InetSoft simplified multi-source integration and reduced manual spreadsheet preparation. Interactive dashboards gave managers and partners clearer, timelier visibility into project progress and risks. The transition improved transparency, cut reporting latency, and supported stronger project governance.
How an Earthen Clayworks Switched from Acumatica Report Designer to InetSoft
Earthen Clayworks switched because ERP-bound reporting could not keep pace with production and sustainability analysis needs. The business needed unified visibility across inventory, process conditions, financials, and environmental metrics. InetSoft connected those sources and provided real-time operational dashboards. Teams could react faster to quality and throughput issues instead of waiting for static report cycles. The company gained more reliable decision support and better communication with eco-focused stakeholders.

How a Stone Quarry Restorer Switched From FineReport To InetSoft
The restoration company outgrew FineReport as projects required richer integration and real-time coordination. It needed to merge geological surveys, environmental monitoring, community metrics, and budget data. InetSoft enabled live dashboards that highlighted milestone status and emerging risk sooner. Project teams could reallocate resources quickly when restoration activities drifted off plan. The switch reduced manual effort and improved both accountability and delivery outcomes.