BI Tool Features List
StyleBI is a real-time business intelligence suite that features a dynamic data mashup tool for the production of dashboards, visual analyses, and reporting.
The incorporated, easy-to-set-up, easy-to-manage business intelligence solution maximizes self-service and serves both businesses and other BI providers.
InetSoft's BI software makes use of a powerful, patent-pending Data Block infrastructure for real-time data mashup and conveys information through interactive dashboards, enterprise reports, scorecards, and exception alerts.
Executive Dashboard Features
StyleBI uses a what-you-see-is-what-you-get approach to facilitate quick and efficient publishing of business dashboards with several marked advantages:
- Track, examine, and analyze data in detail
- Simple to use, alter, and create
- High-performance, easy-to-use end-user data mashup
- Requires very little IT knowledge to execute; perfect for all business users

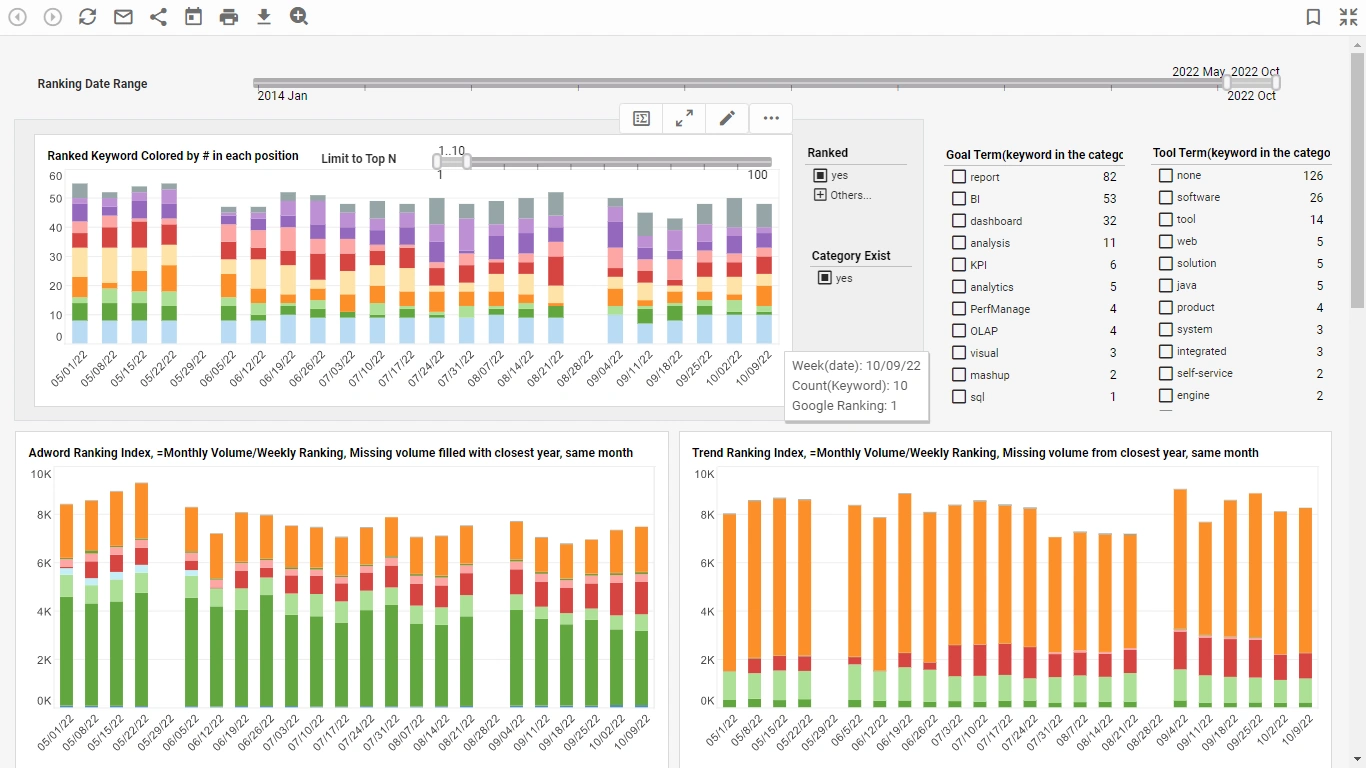
Dashboards grant business users new insight through a high-powered monitoring and analytic setting, resulting in heightened efficiency and accuracy in decision making.

Reporting and Publishing Features
Successful real time reporting comes down to two important goals: high-performance data access and efficient report generation.
InetSoft has sharpened both factors of its real-time reporting solution. Whether is it be pixel-perfect reports or highly stylized visuals, StyleBI will help organizations stay up to date with accurate data reporting.
- Ad hoc reporting wizard
- Server-side Javascript for run-time presentation control
- Report elements such as tables, charts, and subreports
- Bursting for efficient production reporting
- Multiple output and delivery channels
- Data aggregation methods such as sum, average, variance, etc.
- Export formats such as XML, PostScript, Excel, etc.
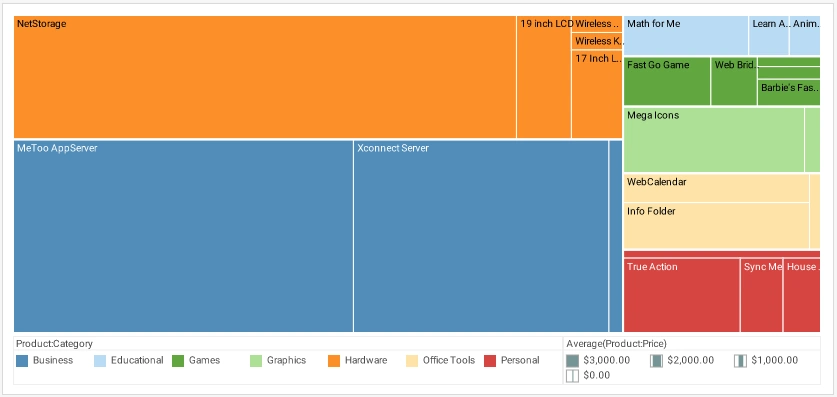
- More than 30 different chart styles
- Formula tables
- Parameter sheets
- Reusable style sheets

Features of Self-service Business Intelligence
-
User-Friendly Data Visualization: Self-service BI tools often offer intuitive drag-and-drop interfaces that allow users to create interactive and visually appealing data visualizations, such as charts, graphs, dashboards, and infographics. This empowers non-technical users to quickly grasp complex data insights.
-
Data Integration: These tools can connect to various data sources, including databases, spreadsheets, cloud services, and more. This integration allows users to pull data from different sources into a centralized platform for analysis.
-
Data Cleansing and Transformation: Self-service BI platforms enable users to clean and transform raw data into a usable format. This includes tasks like filtering, sorting, grouping, and joining data sets, ensuring that the data is accurate and relevant.
-
Ad Hoc Querying: Users can create custom queries and retrieve data in real-time without waiting for IT or data teams to generate reports. This agility in querying speeds up decision-making processes.
-
Interactive Dashboards: Interactive dashboards provide a consolidated view of key performance indicators (KPIs) and metrics. Users can customize these dashboards based on their needs, arranging visualizations and data tiles to gain insights at a glance.
-
Self-Service Data Exploration: Users can explore data on their own terms by drilling down into specific data points, filtering data, and creating on-the-fly calculations. This empowers users to answer their unique questions without requiring extensive technical skills.
-
Data Security and Governance: While enabling self-service BI, it's crucial to maintain data security and governance. Good self-service BI tools offer role-based access control, data encryption, and audit trails to ensure that sensitive data is protected.
-
Predictive and Advanced Analytics: Some self-service BI platforms offer built-in predictive analytics and machine learning capabilities. This allows users to generate forecasts, identify trends, and perform complex analyses without needing expertise in these fields.
-
Collaboration: Self-service BI tools often come with collaboration features that allow users to share reports, dashboards, and insights with colleagues. Collaborative analytics facilitate knowledge sharing and more informed decision-making.
-
Real-Time Data Updates: Users can set up real-time data connections or scheduled refreshes, ensuring that the information they are working with is always up-to-date and accurate.
-
Mobile Accessibility: Many self-service BI tools offer mobile apps or responsive designs, allowing users to access and interact with data on smartphones and tablets, enhancing flexibility and productivity.
-
Cost and Resource Efficiency: By reducing the reliance on IT for generating reports and analyses, self-service BI saves time and resources. It empowers business users to create the insights they need without burdening technical teams.

End-User Features of a Self-service BI Interface
-
Intuitive Data Exploration: A user-friendly interface allows end-users to explore data intuitively. Drag-and-drop functionalities enable users to select data attributes and build visualizations effortlessly.
-
Data Visualization Library: The interface offers a range of pre-built visualization options, including bar charts, line graphs, scatter plots, heatmaps, pie charts, and more. This empowers users to choose the most suitable visualization for their data.
-
Customizable Dashboards: Users can create personalized dashboards by arranging visualizations, charts, and metrics as per their preferences. This customization ensures that users have a tailored view of the data that matters most to them.
-
Interactive Visualizations: End-users can interact with visualizations, such as hovering over data points for additional information, zooming in on specific time frames, or drilling down into data hierarchies for deeper insights.
-
Ad Hoc Querying: Users can create ad hoc queries to retrieve specific data subsets or answer unique questions. This feature enables users to get immediate answers without waiting for predefined reports.
-
Data Filtering and Slicing: The interface allows users to apply filters to data, slicing and dicing it to focus on specific segments. This enables users to analyze data from different angles and perspectives.
-
Real-Time Data Updates: End-users can work with real-time data or schedule automatic data refreshes to ensure that their insights are based on the most recent information.
-
Data Annotations: Users can add annotations, comments, or explanations to specific data points or visualizations. This promotes collaboration and enhances the context around the insights being shared.
-
Predictive Analytics: Some self-service BI interfaces offer predictive modeling tools that enable users to forecast trends, perform regression analyses, and make data-driven predictions without advanced statistical knowledge.
-
Export and Sharing Options: End-users can export visualizations, reports, or dashboards in various formats (PDF, Excel, image files) and easily share them with colleagues or stakeholders.
-
Mobile Accessibility: A responsive design or dedicated mobile app allows users to access and interact with data from smartphones and tablets, ensuring data insights are available on-the-go.
-
Collaboration Features: The interface includes features for users to collaborate on analyses and dashboards, such as sharing insights, leaving comments, and working on projects collaboratively.
-
Guided Data Preparation: Some interfaces offer guided data preparation functionalities, helping users clean and transform raw data into a suitable format for analysis without requiring deep technical skills.
-
Training and Support Resources: Comprehensive training materials, tutorials, and support resources are often available to help users get the most out of the self-service BI interface.
-
Data Security and Permissions: End-users can access only the data and functionalities that they have appropriate permissions for, ensuring data security and compliance.