Machine Learning Enhancements to Traditional BI
Automated data preparation and enrichment
Machine learning automates repetitive data-prep tasks that traditionally slowed BI projects. Algorithms for entity resolution, anomaly-aware cleansing, and schema matching reduce manual ETL effort by automatically identifying likely duplicates, correcting inconsistent formats, and suggesting joins across disparate sources. Feature extraction and automated enrichment add derived variables such as rolling averages, trend indicators, and predicted categorical groupings that make dashboards immediately more informative without lengthy preprocessing cycles.
Anomaly detection and proactive alerts
Integrating unsupervised and semi-supervised ML into BI enables continuous anomaly detection on streaming and batch data. Rather than relying on static thresholds, models learn normal patterns for seasonality, promotion effects, and operational baselines, flagging deviations that warrant investigation. Embedded dashboards can surface those anomalies with context and severity scoring so teams act on high-impact events quickly, reducing incident detection time and limiting downstream business disruption.
Predictive analytics embedded in reports
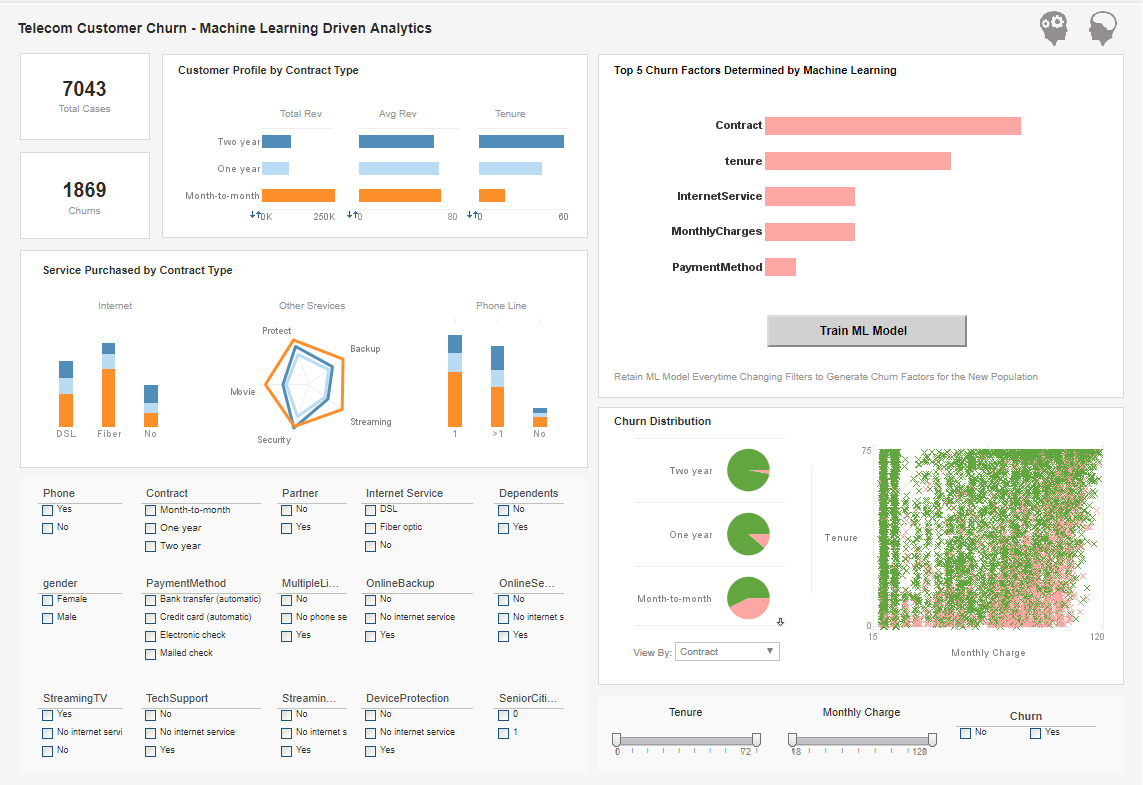
Traditional descriptive BI evolves into forward-looking decision support when prediction models are embedded directly into dashboards. Sales forecasts, churn probabilities, demand forecasts, and failure risk scores appear alongside historic charts so users see likely futures without leaving the BI tool. This tight integration shortens the insight-to-action loop: decision-makers plan inventory, prioritize outreach, or schedule maintenance based on model outputs presented in the same operational view.
Prescriptive recommendations and decision automation
Beyond predicting outcomes, ML-driven prescriptive modules generate ranked recommendations and optimal actions. Optimization models and reinforcement learning can suggest replenishment quantities, dynamic pricing adjustments, or targeted retention offers. When surfaced in BI, these recommendations include expected impact and confidence, allowing users to accept, modify, or simulate them. In some workflows, recommendations feed automated pipelines that execute approved actions, blending visualization with operations.
Natural language querying and conversational analytics
Natural language processing bridges the gap between business users and complex data models. Conversational interfaces let non-technical users ask questions in plain English and receive charts, tables, or written explanations. ML-based intent detection and entity extraction map user queries to relevant datasets and visualizations, democratizing access to insights and reducing dependency on specialist report builders or data teams.
Personalization and role-specific views
Machine learning personalizes dashboards based on user behavior, role, and historical interactions. Recommendation engines surface the most relevant KPIs, filters, and bookmarks for a given user, while clustering algorithms suggest cohorts or segments worth monitoring. Personalized views reduce cognitive load, increase adoption, and help users focus on the subset of metrics that drive their daily decisions.
Augmented analytics and insight generation
Augmented analytics applies ML to surface statistically significant relationships, root causes, and trend drivers automatically. Correlation and causal inference modules highlight the variables most associated with an outcome and present simple narratives that explain the findings. This automated insight generation turns passive dashboards into active analytic assistants that propose hypotheses and next steps.
Operationalization and model lifecycle in BI
Integrating ML into BI requires model lifecycle management: training, validation, deployment, monitoring, and retraining. Modern BI platforms that embed ML provide pipelines to schedule model refreshes with new data, log prediction performance, and trigger retraining when drift is detected. Seamless operationalization ensures predictive features remain accurate and reduces the technical gap between data science prototypes and production-grade analytics used by business teams.
Explainability and trust-building
Explainable ML techniques enhance BI by making model outputs interpretable. Feature importance, local explanations, and counterfactual scenarios are exposed in dashboards so users understand why a score was assigned. Transparent explanations improve trust, speed adoption, and support compliance by enabling audits of decision logic presented alongside the visualized predictions.
Governance, compliance, and risk control
Embedding ML in BI surfaces new governance needs but also enables better control. Automated lineage tracking links model predictions to source data and transformation steps, audit logs record who ran which model and when, and role-based controls limit access to sensitive features. These capabilities make it feasible to extend analytics while maintaining regulatory compliance and enterprise risk policies.
Improved ROI through faster, data-driven actions
Combining traditional BI with machine learning increases the business impact of analytics by turning insight into prediction and action. The result is measurable: reduced waste through optimized operations, higher conversion through targeted campaigns, and lower downtime from predictive maintenance. The synergy of visualization plus ML shortens decision cycles, increases accuracy of resource allocation, and elevates BI from passive reporting to an active driver of business value.

