Amazon Redshift Dashboard Software
Take your Amazon Redshift data to the next level with InetSoft's BI Solution. StyleBI enhances data utilization by employing a powerful data mashup engine, with custom web connectors for Amazon Redshift and a host of other data sources, both on-premise and in the cloud.
StyleBI's simple interface eliminates the obstacle of IT training that standard data warehousing tools require. After a fast deployment, InetSoft's user-friendly BI software maximizes self-service with automated query requests and reporting capabilities.
InetSoft's robust data mashup engine can seamlessly integrate and handle vast amounts of disparate data to create a single source of information. The ability of users to massage data from data warehouses and store necessary data in-memory makes the traditional ETL process unnecessary, diminishing latency in the data warehouse.
| #1 Ranking: Read how InetSoft was rated #1 for user adoption in G2's user survey-based index | Read More |
Mashing up Your Amazon Redshift Data
StyleBI's reporting and dashboarding tools can work with virtually any data source or operational database, so producing an analysis report or generating an interactive dashboard will present reliable and accurate information that reflects all accumulated knowledge.
The reporting engine tool grants users the rapid conversion of time-sensitive information into a publishable report format for easy sharing and distribution. Users will be able to easily deliver sophisticated and professional quality reports for effective presentations and publications.
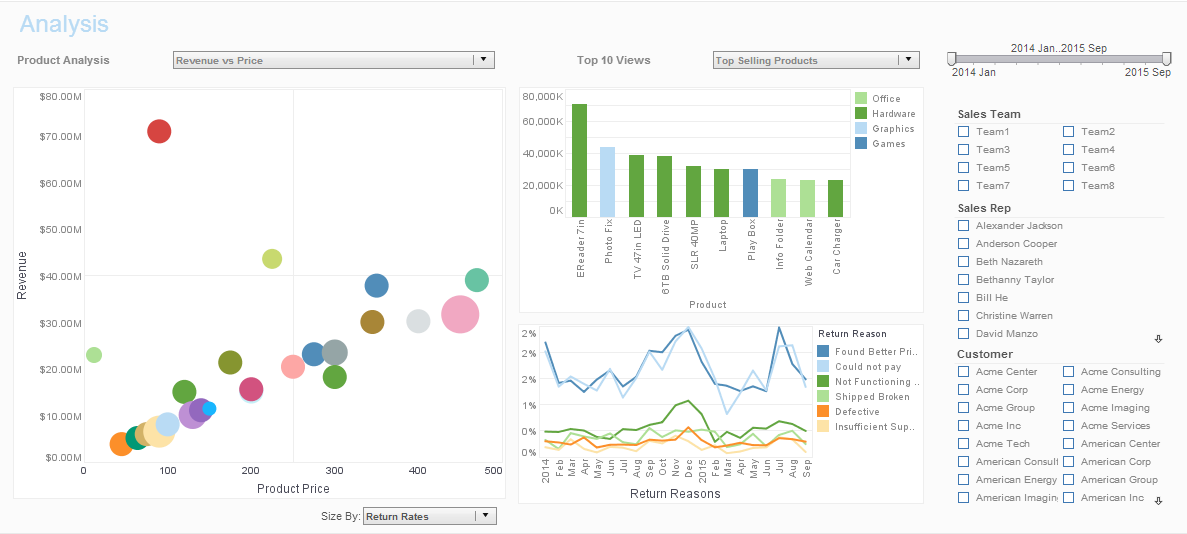
InetSoft's user viewsheet brings end-user functionality to the data warehousing environment, by enabling users to create interactive dashboards with a simple drag-and-drop interface. These dashboards give enterprises the ability to measure KPI's and perform data analysis visually, revealing new insights to non-technical users.
Read more about InetSoft's in-memory database technology to learn how it works and what its advantages are over a pure in-memory solution. |
Case Study: Transforming Operations at a Leasing Services Company with Amazon Redshift Dashboards
Pinnacle Leasing Services, a mid-sized company specializing in leasing equipment and vehicles to businesses, has been operating for over a decade. The company manages a large portfolio of assets and has a diverse client base. However, as the business grew, so did the complexity of its data management and reporting needs. To stay competitive and improve operational efficiency, Pinnacle Leasing Services needed a robust solution to handle their data integration and analysis challenges.
Challenges
- Data Silos: Data was stored in disparate systems, including CRM, ERP, and asset management platforms, leading to data silos and making comprehensive analysis difficult.
- Manual Reporting: Generating reports required manual data extraction and consolidation, which was time-consuming and error-prone.
- Limited Insights: The existing systems lacked advanced analytics and real-time insights, hindering decision-making and strategic planning.
- Scalability Issues: As the company grew, their existing data infrastructure struggled to scale, leading to performance bottlenecks.
Solution
Pinnacle Leasing Services decided to implement Amazon Redshift, a fully managed data warehouse service, to address these challenges. By leveraging Amazon Redshift's capabilities, they aimed to create integrated, real-time dashboards that could provide comprehensive insights and improve operational efficiency.
Implementation
The implementation process was carried out in several phases:
- Data Migration and Integration: Data from various sources, including CRM, ERP, and asset management systems, was migrated to Amazon Redshift. ETL (Extract, Transform, Load) processes were established to ensure data was cleaned, transformed, and loaded efficiently.
- Dashboard Development: Using Amazon Redshift, interactive and real-time dashboards were developed to provide insights into key business metrics. These dashboards were customized to meet the needs of different departments, such as sales, operations, and finance.
- Training and Adoption: Employees were trained on how to use the new dashboards and interpret the data. This included workshops and ongoing support to ensure smooth adoption.
- Performance Optimization: Continuous monitoring and optimization were performed to ensure the data warehouse and dashboards operated efficiently, even as data volume grew.
Benefits
The implementation of Amazon Redshift dashboards brought about significant improvements across various aspects of Pinnacle Leasing Services' operations:
- Unified Data View: By integrating data from multiple sources into a single platform, Pinnacle Leasing Services achieved a unified view of their operations. This eliminated data silos and enabled comprehensive analysis.
- Real-Time Insights: The real-time capabilities of Amazon Redshift allowed the company to access up-to-date information. This improved decision-making and enabled more agile responses to market changes.
- Efficiency Gains: Automated ETL processes and real-time dashboards significantly reduced the time and effort required for data preparation and reporting. This freed up employees to focus on higher-value tasks.
- Advanced Analytics: With Amazon Redshift's advanced analytical capabilities, Pinnacle Leasing Services could perform deeper analyses, such as predictive modeling and trend analysis. This provided valuable insights for strategic planning.
- Scalability: Amazon Redshift's scalability ensured that the data warehouse could grow with the company's needs, eliminating performance bottlenecks and supporting future growth.
Results
Within the first year of implementing Amazon Redshift dashboards, Pinnacle Leasing Services experienced measurable improvements:
- Reporting Time: The time required to generate reports decreased by 75%, thanks to automated processes and real-time data access.
- Operational Efficiency: Efficiency improvements led to a 20% reduction in operational costs, as employees spent less time on manual data tasks and more on strategic activities.
- Customer Satisfaction: Improved data accuracy and faster response times resulted in a 15% increase in customer satisfaction scores.
- Sales Performance: The sales team benefited from better visibility into customer data and market trends, leading to a 10% increase in new lease agreements.
- Strategic Planning: Enhanced analytical capabilities enabled the company to make more informed strategic decisions, positioning them for future growth and success.
 |
Click to read InetSoft's client reviews and comments to learn why they chose InetSoft. |


