Guide to Analytic Reporting
Building analytic reports don't have to take all day. This article will detail how to build analytic reports that are informative and easy to read. StyleBI enables this analytics process to be performed intuitively, using visual input controls such as sliders and selection lists. The analytical dashboard software also can be modified to display any key performance indicators that the designer desires.
InetSoft's dashboard application also allows exception alerts to be set for individual KPIs. Analytical scorecards may be constructed, centralizing KPIs on an easy to understand report.


What is Analytic Reporting?
Analytic reporting is the process of creating business reports that help managers make better decisions.
For example, a marketing executive would review a marketing analytical report to identify weak points in existing marketing campaigns.Marketers often use reporting software to create these necessary reports.Analytical reports can be everything from text heavy documents (such as spreadsheets) to visual presentations with many charts and graphical represenations of data.
A quick google search will show many of these text-heavy documents with a formal writing style, often with a table of contents on page one. There are also visualization heavy reports that catch an executives or stockholders attention, like the example here.
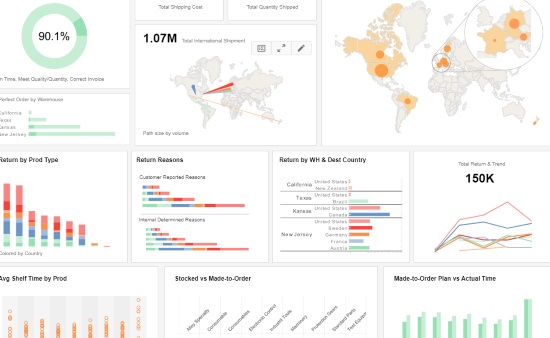
What you see here is a supply chain report example created from data visualization tools such as InetSoft's. Instead of a block of text that competes for attention, busy executives see a collection of eye catching charts that turn their department's data into actionable insights.
This is made possible by robust data mashup technology. InetSoft's BI solution allows all necessary data to be combined from various sources into one automated report, saving you hours of work. Try InetSoft's test drive today to create visually pleasing reports without needing technical expertise.
How to Write an Analytic Report?
InetSoft is here to make your life easier. You don't need to master data science to learn how to build a visually compelling automated report.
It takes only a few minutes to create an analytic report with InetSoft
- Connect your data sources
- Create a new report.
- Pick your desired key performance indicators (KPIs)
InetSoft allows you to connect all relevant data in a single report
Do you need to create an SEO and social media report? Just connect your data source and drag out charts, tables and KPIs. You can also customize the overall look of your analytic report with a few clicks. Whether it's a client's logo, color theme, or misplaced metrics, simply click to change or drag and drop as you wish.
Struggling to explain your insights via email or chat? Use the comment feature to explain your action plan. Coworkers will be able to review the results and your thoughts in one place. With automated marketing reporting software like InetSoft, you'll never have to worry about your analytic reports again.
Start your InetSoft test drive now.
Examples of Analytic Reports
Executive Report Example
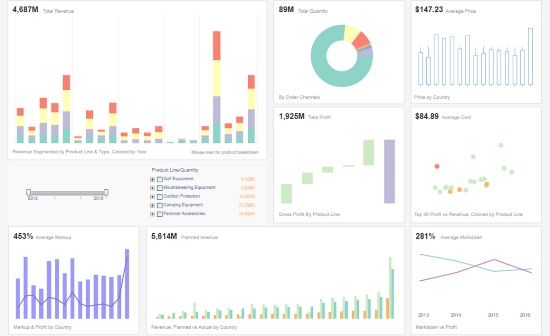
An executive report is an essential tool for every C-suite executive. Here we have a dashboard that covers all important aspects of managing a business. The top left chart breaks down revenue by product line and type, colored by year.
Another chart shows average markup and profit by country. For any executive who wants to effectively manage sales, such as adapting their business processes for effective cost management, these charts provide a wealth of insights.
Digital Marketing Report Example
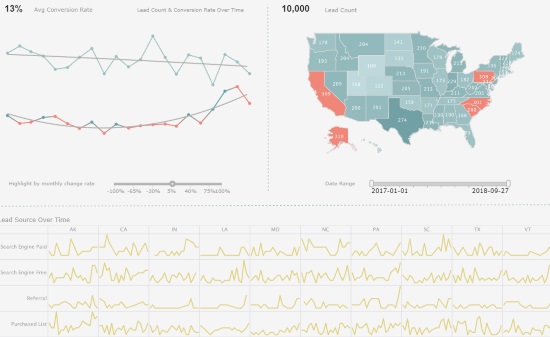
It's an old adage in marketing that you are wasting at least half of your marketing budget at any time. But how to determine which half? This marketing lead trend dashboard tracks the amount of leads from various sources, and also measures conversion rates.
If you want to improve ROI and understand how customers find you, look no further than this digital marketing dashboard. Notice how the little multi-charts let you visually scan many channels and periods in seconds to identify any positive or negative surprise that you can drill into next.
Customer Service Report Example
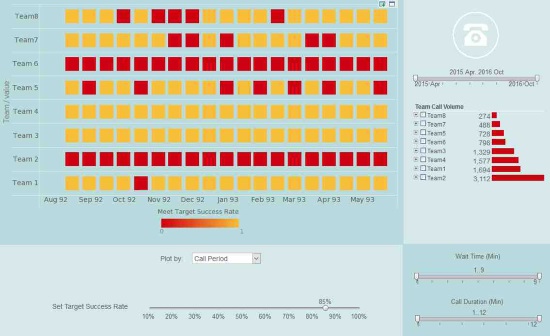
Managing a call center can be overwhelming when you have so many employees. An interactive customer service report can make managing your representatives easier. This customer service dashboard shows the breakdown of calls and issues handled by different teams, with drilldown to individual team members.
It's a breeze to manage your customer support teams with a visual dashboard. For instance, if you notice that one team is taking a particularly low number of calls, you can expand the team in the selection list to see if any individual members are dragging the team down.
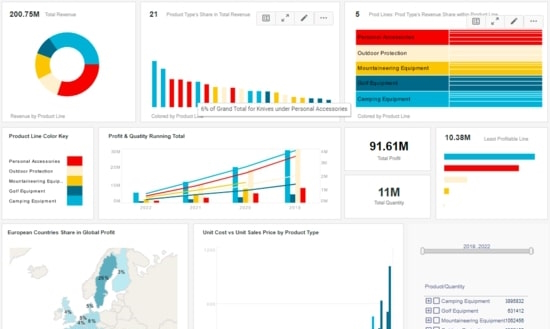
Profit Analysis Report Example
Getting a big picture overview of your sales and profits can be difficult without an informative dashboard report. Note how this profit report untangles large amounts of information by transforming them into comprehensible charts and KPIs.This sales profit dashboard gives you a complete view of your sales and profit metrics.
For example, the Profit and Quantity Running Total shows growth in profit and quantity sold from year to year. You can easily spot top and bottom performers by country with the map visualization.
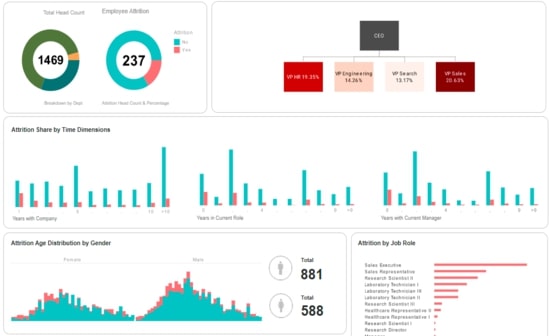
Human Resources Report Example
When it comes to human resources, it's all about building a positive company culture that makes employees want to stay. In our second to last analytic report example, we see a dashboard breaking down employee attrition by various factors.
This dashboard goes beyond simple attrition percentages. It breaks down attrition by gender, job role, and years at the company, to help HR managers identify potential problems in company culture. The organization chart is a useful non-standard visualization type that is essential in people management solutions.
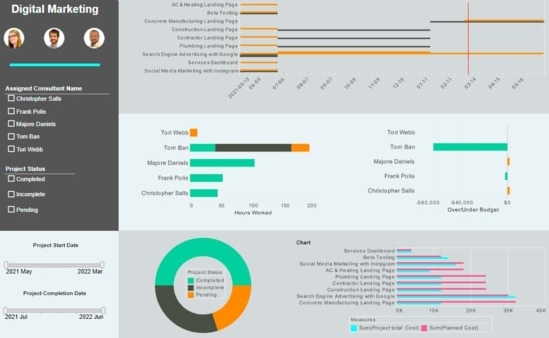
Project Management Report Example
Proper project management involves tracking all segments of an initiative. In this project management dashboard, we see each stage of a project, as well as the total number of hours worked by each person.
With the insights you've gathered in this report, from project cost to over/under budget, you'll know how to reap higher returns from your team in no time. Spot who is behind schedule so you can intervene before problems become critical.
Create Your Analytic Report With InetSoft Today
Not only do they accurately represent your business to shareholders, they also help these decision-makers to make informed decisions. Building reports used to be quite a process, involving gathering data from multiple sources, massaging it and mashing it up in a data warehouse, then executing a SQL query on it to run a report.
Fortunately, automated reporting tools make the process much quicker. InetSoft's data mashup can bring all data sources into a single report. From relational databases, to cloud sources, you can finally create analytic reports that contain all the information you need.
Start the InetSoft test drive today.