InetSoft's BI Query Tool
Traditional methods of database query involve coding SQL queries manually. InetSoft's BI query tool is designed to replace coding to with visual operations so that manually coding queries is no longer necessary.
With this tool, non technical users can create queries by adjusting visual elements, opening up the world of query to all who desire to use it. InetSoft’s BI query tool automatically optimizes the underlying queries for the quick retrieval of data.
InetSoft's query tool is fused with visual analysis. Therefore, query results are easily turned into visual dashboards or reports. For least technically inclined users, certain queries can even be satisfied with visual dashboards alone.

Query and Data Mashup with Visualization
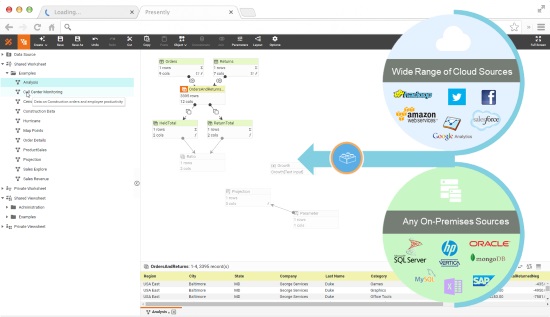
Foremost, InetSoft’s query builder allows users to query SQL databases for an interactive reporting experience. The automatic generation of SQL queries occurs in two places. The first level, or the InetSoft data worksheet, is the level in which the data is imported into the software according to visually built query. The second level is in the interactive dashboard, or report, where queries are adjusted based on interactive filters and selection elements. Both of these tools make it possible for the BI query tool to return whatever information a user may seek. However, InetSoft BI query tool extends far beyond SQL query.
Query & Data Mashup
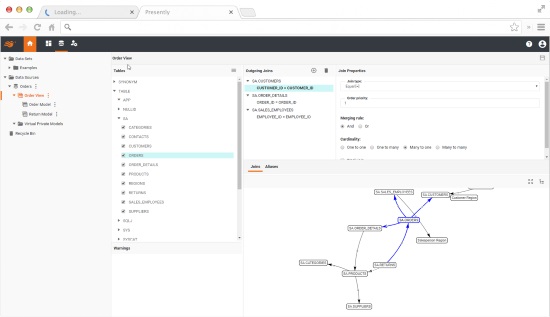
As a default feature, the worksheet presents a single SQL query that accumulates the table’s data from the connected datasource. But this web-based tool also allows power users to create queries that join tables from disparate data sources. These queries are created automatically through a drag and drop interface whereby a user selects a field from one datasource table and drags it over to join with the field from another datasource table.
This joined table can then be further transformed through filtering, grouping, adjusting the join type, and other automatic modifications to massage the data as it comes into the software. This modified data can then be used as a basis for interactive dashboards and reports, aggregating the disparate data into charts and key performance indicators.
Data Model Enabled Self-Service
For non-technical users, InetSoft offers analysts and designers the ability to create data model that maps all data fields into business sensible data items. This mapping can also include data transformation functions. Data security controls will ensure users will only access data that they have being granted permissions. Ad hoc queries are automatically generated based on the data model. The data model also has configurable safety valves that will capture runaway queries or prevent unreasonable large result sets.
End users can access this data model from various visual interfaces. The report wizard is step-by-step, guided zero-training tool with which any user can generate a query. Power users can use the visualization composer to create sophisticated queries.
Reporting & Visualization From a BI Query
In a single InetSoft web app, you can directly bring query results into dashboards or reports. Additional parameters and filtering allow users to futher customize for their needs.
Case Study: Advancing Neuroscience Research with Visual-Driven BI Query Tools
The NeuroBrain Research Institute (NBRI) is a premier organization dedicated to advancing the understanding of the human brain through cutting-edge neuroscience research. Established in 1990, NBRI collaborates with academic institutions, hospitals, and pharmaceutical companies to explore brain functions, neurological disorders, and potential treatments. The institute's mission is to translate complex brain research into meaningful clinical applications that improve patient outcomes.
Challenge: NBRI faced significant challenges in managing and analyzing the vast amounts of data generated from its research activities. Data sources included brain imaging, electrophysiology, genetic sequencing, and clinical trial results. The complexity and volume of data made it difficult for researchers to extract meaningful insights efficiently. Traditional data analysis methods were time-consuming and required specialized knowledge in data querying and interpretation, hindering the institute's ability to make rapid scientific advancements.
Solution: To address these challenges, NBRI decided to implement a visual-driven BI query tool built into a comprehensive analytics platform. The selected tool aimed to simplify data analysis, enable real-time visualization, and facilitate collaboration among researchers. After evaluating several options, NBRI chose a platform known for its intuitive interface, robust visualization capabilities, and seamless integration with existing data sources.
Implementation: The implementation of the visual-driven BI query tool was executed in several phases:
- Data Integration:
- Data from various sources, including MRI and fMRI scans, EEG recordings, genomic data, and clinical trial databases, was integrated into a centralized data warehouse. The ETL (Extract, Transform, Load) process ensured data consistency and facilitated comprehensive analysis.
- Platform Setup:
- The BI query tool was configured to connect seamlessly with the data warehouse. Customizable dashboards and visualization templates were created to cater to the specific needs of neuroscience researchers, allowing them to explore data interactively.
- Training and Adoption:
- Comprehensive training sessions were conducted to familiarize researchers with the new tool. Workshops and hands-on sessions emphasized the ease of use, empowering researchers to perform complex data queries and generate visual reports without relying on IT specialists.
- Collaborative Features:
- The platform's collaborative features, such as shared dashboards and real-time data sharing, were leveraged to enhance teamwork and streamline research efforts. Researchers could now work together on data analysis, share insights, and co-author reports.
Results:
- Enhanced Data Accessibility:
- The visual-driven BI query tool made it easy for researchers to access and analyze large datasets. The intuitive interface allowed researchers to perform complex queries using drag-and-drop functionalities, reducing the time spent on data preparation and analysis by 40%.
- Improved Research Efficiency:
- Real-time data visualization enabled researchers to identify patterns, correlations, and anomalies quickly. This capability accelerated hypothesis testing and data interpretation, leading to a 30% increase in the pace of research projects.
- Data-Driven Insights:
- The platform facilitated the discovery of new insights by allowing researchers to visualize data from multiple perspectives. For instance, brain imaging data could be correlated with genetic information to uncover new biomarkers for neurological disorders.
- Enhanced Collaboration:
- The collaborative features of the BI tool fostered a more integrated research environment. Researchers across different departments and partner institutions could share findings and co-develop research strategies, leading to more cohesive and comprehensive studies.
- Increased Funding and Publications:
- The improved efficiency and data-driven insights contributed to a higher success rate in securing research grants. Additionally, the ability to generate compelling visual reports and data presentations resulted in an increase in high-impact publications by 25%.
More Articles About BI Query Tools
Design Dashboards Online with InetSoft - Are you looking for a good application for designing dashboards online? InetSoft is a pioneer in self-service dashboarding and offers an easy tool for creating them. View a demo and try interactive examples...
Embedded Charts for Easy Integration - InetSoft provides a chart and data access engine that ISV's or SaaS providers can use to embed charts in their applications. InetSoft's embeddable charts provide: a visually compelling charts and graphs that will appeal to all users a high level of interactivity and self-service for new chart creation intuitive controls such as list boxes and drop-downs which minimize training...
Manufacturing Metrics Dashboard Example - Manufacturing processes generate volumes of data that must be monitored and analyzed for peak performance and efficiency. By observing and analyzing these processes, companies can gain an understanding of the different shifts and trends which progress and hinder their business. This knowledge provides managers with great insight to act accordingly and make decisions in a confident manner...
Versatile Tools for Better Solutions - StyleBI's reporting and dashboarding tools can work with virtually any data source or operational database, so producing an analysis report or generating an interactive dashboard will present reliable and accurate information that reflects all accumulated knowledge. The reporting engine tool grants users the rapid conversion of time-sensitive information into a publishable report format for easy sharing and distribution. Users will be able to easily deliver sophisticated and professional quality reports for effective presentations and publications...