Box Reporting Software
Box's software is a platform for content management, workflow, and project management. Effective project reporting is essential for an organization's progress and should be implemented at all levels ranging from employees to owners and executives. The right status reporting software will integrate all relevant sources of data, making it easy to keep all of an organization's activities in check.
InetSoft's flagship tool, StyleBI, includes a custom web connector for Box data, as well as connectors for a host of other data sources, both cloud and on-site.
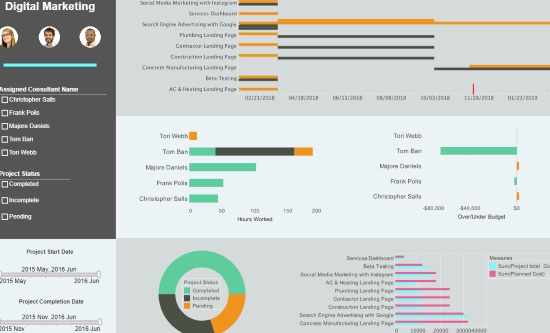
Project managers foremost need project progress and coordination information such as dashboards displaying Gantt charts (see dashboard example). However, Box dashboards and reports must be able to go beyond core project management data to give a holistic view of all factors that can impact on-time, on-budget delivery.
| #1 Ranking: Read how InetSoft was rated #1 for user adoption in G2's user survey-based index | Read More |
Benefits of Box Dashboards and Reports with InetSoft
Project and workflow reporting represents the critical reporting relationship between project managers and employees, as well as managers and executives. Using an agile status reporting tool such as InetSoft's Style Intelligence provides users an efficient platform to create reports and keep management updated on company and employee progress.
Project managers interact, share and collaborate with many parties. Visualization dashboards works excellently in most cases. Offline distributable reports become essential for many occasions where parties must share a large amount of information. InetSoft's pixel perfect, paginated document report engine is specifically desigend for these cases.
More About InetSoft's Reporting Software for Box
Visualization dashboards are the most intutive ways to understand Box data. However, not all dashboards are created equal. InetSoft's web app can easily connect to other sources of project management data, to create self-service dashboards with rich built-in interactivity and customization.
For successfull delivery of projects, project managers must utilize all project related data, for example, supply chain and issue tracking system data. These systems are normally scattered. Some third party data may even be in Excel files. InetSoft's data mashup makes data processing a light-weight, business user self-serviceable process with great efficiency.
 |
Learn how different InetSoft's data mashup technology is and how it turns traditional BI approaches upside down. |
What KPIs and Metrics Do Box Software Users Track?
Box software users, like users of any other collaboration and file-sharing platform, track a range of Key Performance Indicators (KPIs) and metrics to assess the effectiveness of their usage and to optimize their workflows. Here are some common KPIs and metrics that Box software users may track:
- Usage Metrics:
- Active Users: The number of users actively using the Box platform within a specified time period.
- User Engagement: Metrics such as logins, file uploads, downloads, comments, and shares per user.
- Adoption Rate: The rate at which users adopt and regularly use the Box platform.
- Storage and Content Metrics:
- Storage Usage: The amount of storage space consumed by files and documents stored on the Box platform.
- Content Growth Rate: The rate at which the volume of content stored on Box is increasing over time.
- File Access Frequency: The frequency with which files are accessed and viewed by users.
- Collaboration Metrics:
- Collaboration Activity: Metrics related to collaboration activities such as file sharing, document editing, and task assignments.
- Team Collaboration: Metrics indicating the level of collaboration within teams or departments, including file sharing within groups.
- Security and Compliance Metrics:
- Data Security Compliance: Metrics related to adherence to security and compliance standards, including data encryption, access controls, and audit trails.
- Policy Violations: The number of instances where security or compliance policies are violated, such as unauthorized access attempts or sharing sensitive information externally.
- Performance Metrics:
- Platform Performance: Metrics related to the performance and reliability of the Box platform, including uptime, response time, and error rates.
- User Satisfaction: Feedback from users regarding their satisfaction with the performance and usability of the Box platform.
- Cost and Resource Management:
- Cost per User: The cost of using the Box platform per user, including subscription fees and any additional costs related to storage or usage.
- Resource Utilization: Metrics indicating the utilization of resources such as storage space and bandwidth.
- Integration Metrics:
- Integration Usage: Metrics related to the usage of integrations with other software applications, such as productivity tools, CRM systems, or project management platforms.
- Integration Effectiveness: The impact of integrations on productivity, efficiency, and workflow automation.
- Training and Support Metrics:
- Training Completion Rate: The percentage of users who have completed training or onboarding programs for using the Box platform.
- Support Ticket Resolution Time: The average time taken to resolve user support tickets or inquiries.
- Mobile Usage Metrics:
- Mobile App Usage: Metrics related to the usage of the Box mobile app, including downloads, logins, and file interactions.
- Mobile Collaboration: The extent to which users collaborate and access content via mobile devices.


