Client Scorecard Example
InetSoft's comprehensive real-time analytical reporting and dashboard software provides users with client scorecards that serve to monitor, measure, and manage performance by tracking metrics in real-time.
Scorecarding is a proven approach for monitoring, measuring and managing performance by tracking metrics. A scorecard is a list of key performance indicators (KPIs), or metrics, that present current performance data for a business process or strategy against goals, quotas, and target trends.
The StyleBI Scorecard is a collection of objects known as 'Targets'. Each target helps monitor the performance of a metric. It specifies the metric, how and when a metric's performance is evaluated, what the goal or target is, and what action to take if the goal is not met.
The scorecard provides an easy way to monitor multiple targets on a single page. In addition to checking status, you can drill down on a metric to see more detail, and set up alert notification for a failing metric.


Effective Scorecard Design
First and foremost, to be a useful, a scorecard must track the right key performance indicators. The ultimate goal of creating a scorecard is to identify a select number of business metrics and assign objectives to them. When referred to later on it should be possible to reach a solid conclusion regarding performance versus expectations.
Methods for creating a scorecard have evolved many times since they became a popular BI tool. Today there are four main components to consider before creating one:
- A destination statement
- A strategic linkage model outlining how one plans to achieve said goals
- A definition for each goal
- A definition for each measurement
Once these four elements have been carefully considered and laid out by management, one can begin creating a scorecard.
The destination statement defines the final goals that an organization is attempting to reach by creating a scorecard in the first place..
The strategic linkage model is a cause-and-effect outline of how an organization will ultimately reach an end goal. This is typically a strategy map that links activities to their hypothesized results.
Goal and measurement definitions are important to ensure all aspects of a business remain on the same page. These need to be clearly and concisely expressed in order align objectives with performance.More Client Scorecard Examples
Below are some client scorecard examples to give you a look at some of the advanced displays that can be created using Style Intelligence. Style Intelligence can be used to build visualizations for any type of department or industry. These visualizations can be built by nontechnical users with a basic Excel level understanding of data.
Marketing Consultant Scorecard

This marketing consultant scorecard tracks the status of various marketing projects and compares them to a goal completion date, displayed with a red line.
Actual cost of projects is compared to planned cost, so managers can ascertain whether or not consultants are delivering on their promises.
Lead Pipeline Scorecard

This lead pipeline scorecard compares lead volume and conversion rates against benchmarks set by marketing managers. A large map chart displaying new leads by state displays states with lead amounts that reach goal in a different color. A line chart showing lead conversion rate shows a red highlight when conversion rate dips by too large an amount. A slider below the line charts modifies the change rate that results in a chart highlight.
Orders Benchmarking Scorecard

This orders benchmarking scorecard breaks down orders by state, date, and sales team member.
A bar chart displays the orders sold by each salesperson, with a diamond shape representing their goals, for easy comparison.
A calendar display enables drilldown by individual week or month.
Team Performance Scorecard

This team performance scorecared makes it easier for call centers to measure the effectiveness of their customer service teams. A red highlight shows when teams fall below goals on call period, call time, call status, and wait time. A slider adjusts the target success rate, so that managers can adjust the goals for effective customer service based on employee experience level and various conditions.
Call Monitoring Scorecard

This live call monitoring scorecard helps call center managers supervise their customer service reps and monitor how their call and wait times compare to goals. An adjustable threshold turns from green to red when there are too many calls in queue. An agent status chart shows, in real time, who is on the phone and for how long. Large KPIs provide the daily call and wait time average, giving managers an at-a-glance picture of customer service quality.
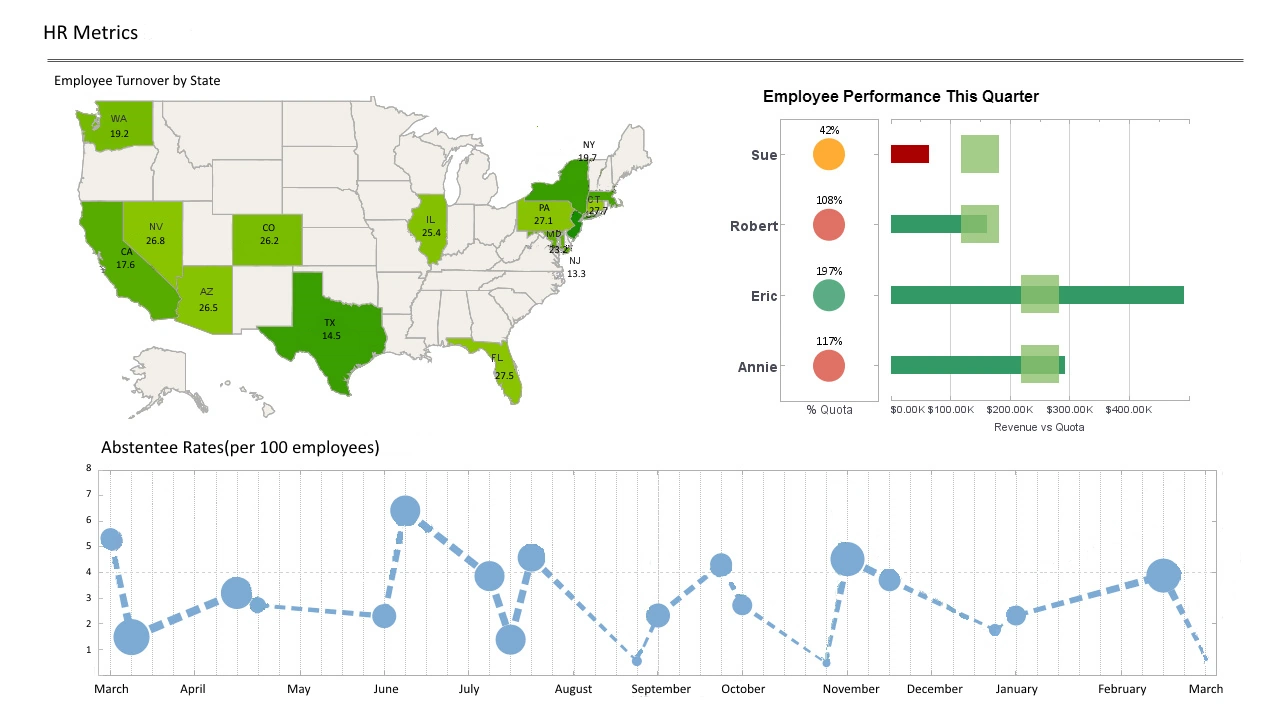
Salesperson Scorecard

This salesperson scorecard gives executives an overview of sales by area, time period, and salesperson.
The Employee Performance by Quarter chart displays employee sales relative to their quota, with bars turning red when performance lags behind the goal.
Key Performance Indicators Tracked by an SEO Firm on a Client Scorecard
SEO firms use client scorecards to track Key Performance Indicators (KPIs) that evaluate the success of search engine optimization strategies. These metrics focus on improving website visibility, driving organic traffic, enhancing user engagement, and boosting conversions. The following KPIs are commonly included to provide clear, actionable insights tailored to client goals.
-
Organic Traffic
Measures the number of visitors arriving at the website from unpaid search engine results. It indicates how well the site ranks for relevant keywords and is a core metric of SEO success. Tools like Google Analytics 4 track organic sessions, helping firms assess content relevance and visibility.
-
Keyword Rankings
Tracks the position of targeted keywords on search engine results pages. Higher rankings for relevant keywords drive more traffic. Tools like SEMrush monitor daily ranking changes, highlighting optimization effectiveness.
-
Organic Click-Through Rate (CTR)
Calculates the percentage of users who click on a website’s link after seeing it in search results. A higher CTR indicates compelling meta titles and descriptions. Google Search Console provides CTR data, guiding content optimization.
-
Organic Conversions
Measures the number of visitors from organic search who complete desired actions, such as purchases, sign-ups, or form submissions. This KPI ties SEO efforts to business outcomes. Google Analytics 4 tracks conversions as marked events, like “purchase” or “sign_up.”
-
Search Visibility
Represents how often a website appears in search results for targeted keywords, expressed as a percentage. It shows early SEO progress, even before traffic increases. Google Search Console tracks total impressions, while other tools monitor keyword-specific visibility.
-
Bounce Rate
Tracks the percentage of visitors who leave the site after viewing only one page. A high bounce rate (above 40-60%) may signal irrelevant content or poor user experience. Google Analytics 4 helps identify pages needing improvement.
-
Average Session Duration
Measures the average time users spend on the website per session. Longer durations suggest engaging, relevant content. Google Analytics 4 tracks this metric, indicating how well the site meets user intent.
-
Backlink Profile
Evaluates the quantity and quality of backlinks from external sites. High-quality backlinks boost domain authority and rankings. Tools like Moz track referring domains and backlink strength, critical for SEO strategy.
-
Domain Authority (DA)
A score (0-100) predicting a website’s ranking potential, based on backlinks and other factors. Higher DA correlates with better search performance. Moz’s Domain Authority metric is widely used to assess site credibility.
-
Return on Investment (ROI)
Compares revenue generated from SEO (e.g., organic conversions) to campaign costs. A positive ROI demonstrates financial value. Calculated as (Gain from Investment - Cost of Investment) / Cost of Investment, it’s key for client satisfaction.
These KPIs provide a comprehensive view of SEO performance, from visibility to business impact. SEO firms use tools like Google Analytics 4, Google Search Console, and others to automate tracking and create client-accessible dashboards. By aligning KPIs with client goals—such as increasing traffic by 30% or boosting conversions—firms ensure measurable success and clear communication.