Completed Dashboard Examples
Dashboards are essential data visualizations that allow users to explore and analyze their data intuitively in order to find business solutions.
Easily completed dashboards benefit enterprises by enabling the fast recognition of strengths and weaknesses, as KPIs and metrics are updated to follow changing business conditions.
A well completed dashboard visually conveys the same information that could only be gleaned by paging through many different reports.
Users of InetSoft's StyleBI can configure original dashboard designs or utilize ready-to-use templates. InetSoft's complete dashboards can be structured to be monitoring-oriented or analysis-oriented.

Complete Dashboards Quickly With Drag-and-Drop
Completing informative and sophisticated dashboards is a simple task with StyleBI. Dashboards are completed with a simple, intuitive drag-and-drop interface that is easy to use, even for those with no IT training.
A drag-and-drop interface is also used to create unique data mashups. With the click of a mouse, the robust data mashup engine will automatically write queries that integrate and manipulate massive amounts of data.
The powerful data mashup engine is flexible enough to handle many data elements, enabling experimental changes that users can save for future use in their dashboards. InetSoft's complete dashboarding tools can make data that would otherwise be overwhelming yield useful insights for your enterprise.
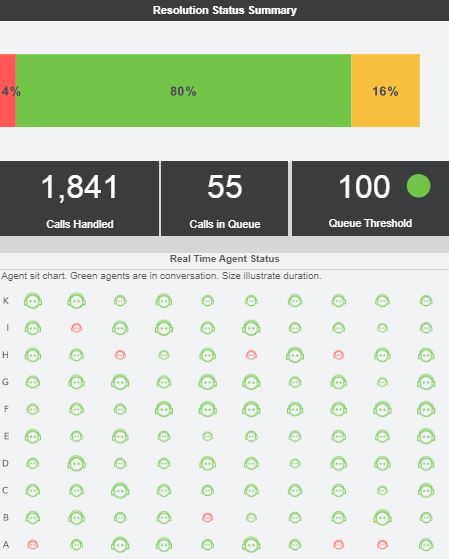
This example is for the manager of a customer service department to track the performance of call representatives in real-time.
Accessibility, Whenever and Wherever
StyleBI is a zero-client program that requires low maintenance, can be deployed rapidly, and has extremely customizable security measures. The web-based software enables users to quickly access and modify dashboards from any web browser, exploring their data and answering questions in real time.
This convenience is extended to mobile devices such as smartphones and tablets, so live engaging dashboards can be shared and utilized beyond a desktop computer.
InetSoft's StyleBI makes it effortless to complete elaborate and interactive dashboards that can extract and combine data from virtually any source, whether on premise or in a public or private cloud. A flexible data mashup engine allows for combination of different metrics to get a complete view of organizational performance.

What Is Tracked on a Physical Security Monitoring Dashboard?
A physical security monitoring dashboard tracks Key Performance Indicators (KPIs) and metrics to oversee the safety, security, and operational efficiency of facilities or organizations. These dashboards provide real-time visibility into security incidents, system performance, and compliance, enabling rapid response and risk management. Below are key metrics commonly included to ensure effective monitoring and decision-making.
-
Incident Response Time
Measures the average time taken to respond to security incidents, such as unauthorized access or alarms. Faster response times (e.g., under 5 minutes) indicate efficient security operations. This KPI helps assess the effectiveness of response protocols and personnel readiness.
-
Number of Security Incidents
Tracks the total number of security incidents, such as theft, vandalism, or breaches, over a specific period. A low or decreasing number reflects strong preventive measures. Monitoring trends helps identify vulnerabilities and prioritize resource allocation.
-
Access Control Violations
Monitors instances of unauthorized access attempts or credential misuse at entry points like doors or gates. A high number of violations may signal weak access controls or training gaps. This metric drives improvements in access policies and system security.
-
Camera Uptime Percentage
Measures the operational availability of surveillance cameras, expressed as a percentage of uptime. High uptime (e.g., above 98%) ensures reliable monitoring and footage availability. This KPI is critical for maintaining continuous surveillance coverage.
-
Alarm Trigger Rate
Tracks the frequency of security alarms triggered by sensors or systems, including false positives. A high rate may indicate system malfunctions or environmental issues requiring investigation. This metric helps optimize alarm settings and reduce unnecessary alerts.
-
Guard Patrol Compliance
Evaluates the percentage of scheduled security patrols completed on time by guards. High compliance (e.g., 95% or above) ensures thorough coverage of the facility. This KPI supports accountability and identifies gaps in patrol execution.
-
Visitor Management Metrics
Monitors visitor check-in/check-out times, total visitors, and compliance with visitor policies. Efficient visitor processing enhances security while maintaining a positive experience. This metric helps identify bottlenecks and ensures adherence to safety protocols.
-
System Health Status
Tracks the operational status of security systems, such as CCTV, access control, and intrusion detection, to identify failures or maintenance needs. A high percentage of systems online (e.g., 99%) ensures robust security coverage. This KPI supports proactive maintenance to prevent downtime.
-
Incident Resolution Rate
Measures the percentage of security incidents resolved within a defined timeframe, such as 24 hours. A high resolution rate (e.g., 90%) indicates effective incident management processes. This metric drives improvements in response strategies and resource allocation.
-
Compliance with Regulations
Tracks adherence to security-related regulations, such as fire safety codes or data protection laws, through audit completion rates. Full compliance (100%) minimizes legal risks and penalties. This KPI ensures alignment with industry standards and regulatory requirements.
These metrics on a physical security monitoring dashboard provide a comprehensive view of security performance, enabling proactive risk management and operational efficiency. Tools like InetSoft’s StyleBI can enhance these dashboards by integrating data from multiple sources, offering real-time visualizations and self-service analytics. Regular monitoring ensures organizations maintain a secure environment while optimizing resources and compliance.
10 Monitoring-Related Articles from InetSoft
Below is a list of 10 articles from InetSoft’s website focusing on monitoring capabilities within their business intelligence and dashboard solutions. Each entry includes a link to the article with anchor text derived from the article’s content and a three-sentence summary highlighting its key points. These articles showcase how InetSoft’s tools, particularly StyleBI, enable effective monitoring of performance, data, and operations.
-
Customizable Data Monitoring
InetSoft’s monitoring dashboard interface allows users to fully customize data visualizations for real-time performance tracking. Administrators can configure monitoring levels to view server activity, report execution, and cache usage, enhancing oversight. The article highlights tools for managing reports, viewsheets, and queries with high granularity.
-
Robust Monitoring Tools
StyleBI provides administrators with tools to monitor user reports, track logins, and manage session terminations. The article details features like asset and system exception tracking to ensure report reliability. It emphasizes quick modifications and performance optimization for effective monitoring.
-
Server Performance Tracking
InetSoft’s dashboard software enables administrators to monitor server status, including servlet operations and license management. The article explains how to start, stop, or restart services and configure RMI/CORBA ports for efficient monitoring. It highlights the platform’s role in supporting Fortune 500 companies with robust server oversight.
-
Performance Monitoring KPIs
This article outlines key performance indicators like load speed, CPU usage, and latency for monitoring web application performance. It emphasizes proactive monitoring to enhance user experience and reduce bounce rates. Regular tracking with reliable tools helps businesses address issues before they impact reputation.
-
Proactive Data Monitoring
InetSoft’s tools enable continuous monitoring of data quality issues to ensure accuracy and reliability over time. The article discusses how tracking new data inputs helps identify and resolve quality problems proactively. This capability supports consistent data integrity for business intelligence applications.
-
Automated Business Monitoring
InetSoft’s report-making software automates monitoring of business performance, handling growing data complexity. The article highlights StyleBI’s ability to track sales, clients, and operational variables with minimal setup. It enables users to generate reports remotely, enhancing efficiency without IT dependency.
-
Efficiency Monitoring Tool
InetSoft’s interactive dashboard software facilitates real-time monitoring of performance metrics to improve operational efficiency. The article emphasizes its user-friendly design, allowing users to track KPIs without technical expertise. It supports dynamic data analysis for quick decision-making across industries.
-
Flexible Reporting Platform
InetSoft’s reporting tool offers a web-based platform for monitoring team status and performance with pixel-perfect reports. The article highlights its flexibility for creating customized dashboards since 1996. It supports real-time tracking, making it ideal for performance oversight.
-
Attorney Performance Metrics
This article explores how InetSoft’s dashboards track attorney productivity through KPIs like hours worked and billing rates. It emphasizes identifying trends and top performers to optimize law firm operations. The platform’s flexibility supports tailored monitoring for legal professionals.
-
Student Performance Monitoring
InetSoft’s university dashboard system enables monitoring of student performance and educational effectiveness. The article highlights its intuitive interface for teachers and administrators to track metrics in real-time. It supports data-driven decisions in educational settings with minimal setup.
These articles demonstrate InetSoft’s expertise in delivering monitoring solutions through StyleBI, emphasizing real-time analytics, user-friendly interfaces, and customizable dashboards. They cater to diverse industries, from legal to education, enabling efficient performance and data quality tracking. By leveraging these tools, organizations can enhance decision-making and operational oversight.