Build Powerful Dashboards with StyleBI
A serverless, cloud-native BI platform for IT professionals to create real-time, interactive dashboards with zero infrastructure overhead.


Key Technical Features
Serverless Microservices Architecture
Deploy StyleBI in Docker containers or cloud platforms like AWS Lambda, ensuring scalability and minimal maintenance. Integrate with existing tech stacks via modular microservices.
Data Mashup Engine
Combine data from disparate sources (SQL, NoSQL, APIs, IoT) using a drag-and-drop interface or custom JavaScript, enabling complex transformations without heavy ETL processes.
Real-Time Data Streaming
Stream live data from monitoring tools, SIEM systems, or cloud platforms with low-latency updates, ideal for real-time crisis management and operational monitoring.
Web-Based Zero-Client Access
Access dashboards via any browser or mobile device without client-side installations, supporting cross-platform compatibility (Windows, Linux, macOS).
Advanced Security Controls
Implement role-based access and single sign-on (SSO) to secure sensitive data, with multi-tenancy support for isolated team environments.
Interactive Visualizations
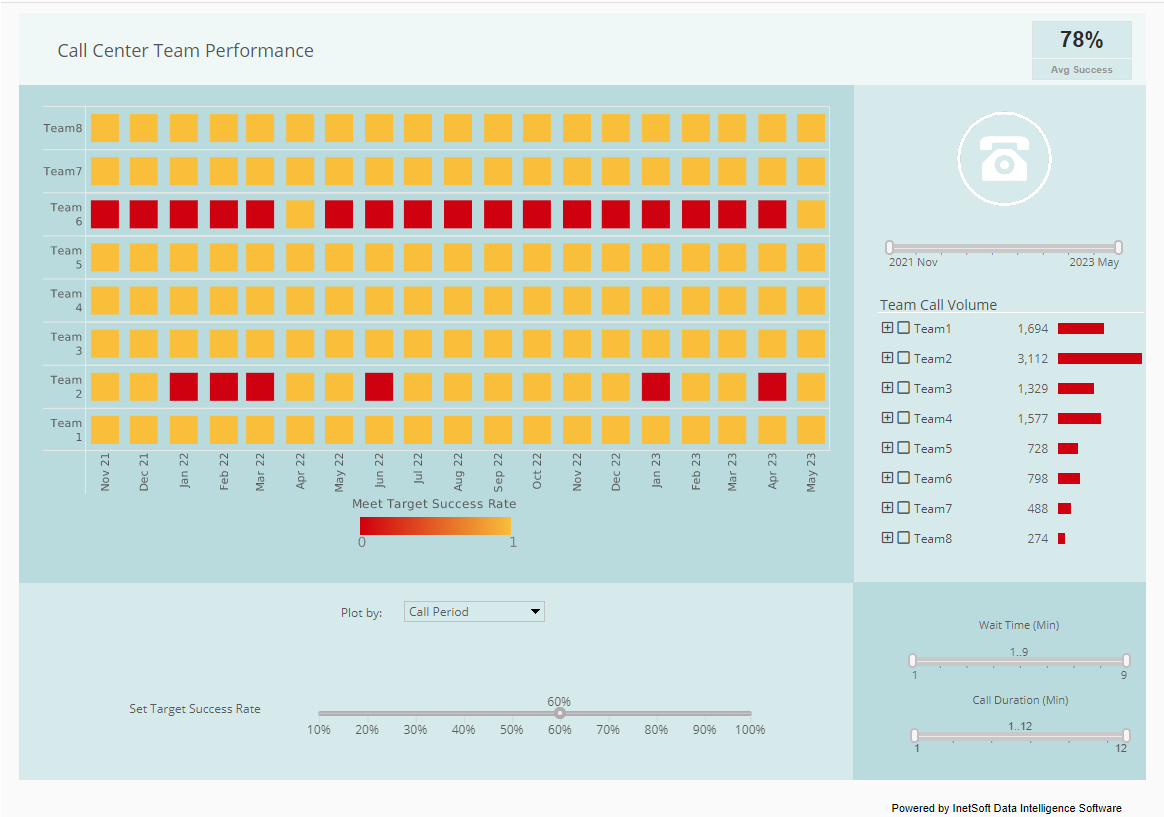
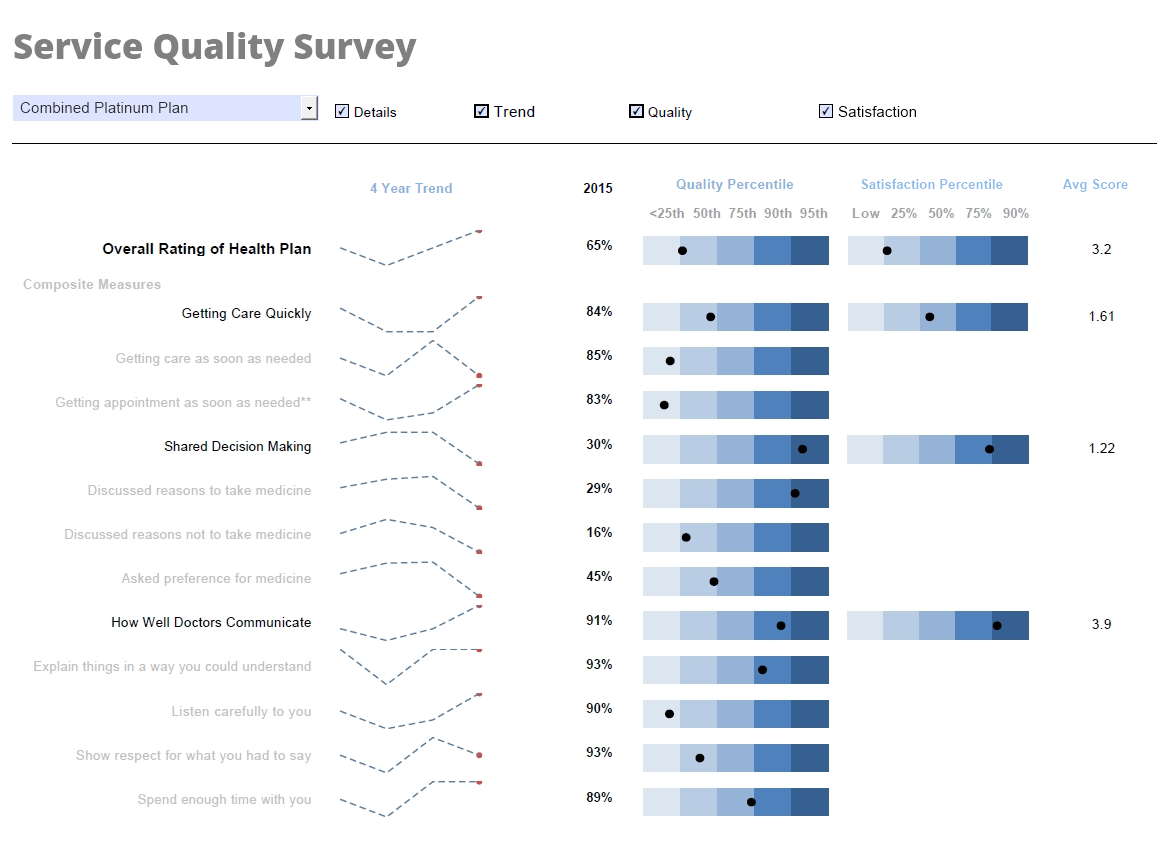
Create dynamic charts, heatmaps, and gauges with drill-down and filtering capabilities, optimized for real-time data exploration and collaboration.
Why IT Teams Choose StyleBI
Rapid Deployment
Spin up dashboards in minutes using the drag-and-drop designer, reducing setup time and IT workload. No dedicated BI developers needed.
Cost Efficiency
Serverless architecture minimizes infrastructure costs, with flexible pricing models tailored for startups and enterprises alike.
Seamless Integration
Embed dashboards into enterprise portals or SaaS platforms via iFrames or APIs, with full white-labeling and OEM-friendly licensing.
Scalable Performance
Handle large datasets and high concurrency with automatic scaling, ensuring low-latency performance during peak loads.
See StyleBI in Action
Explore our interactive demo to experience real-time dashboard creation and data mashup capabilities.
Start FreeReady to Transform Your Data Workflow?
Start building scalable, interactive dashboards with StyleBI today. No infrastructure, no hassle—just results.
Start Free TrialSwitching from Tableau to StyleBI: A Concession Stand Operator’s Journey
For IT professionals managing data analytics for small to medium-sized businesses, the choice of a business intelligence (BI) platform can significantly impact operational efficiency and cost. A concession stand operator, typically managing high-volume, fast-paced environments at events or venues, recently transitioned from Tableau to InetSoft’s Style Intelligence (StyleBI) serverless dashboard microservice. This move was driven by the need to reduce licensing costs, minimize resource overhead, lower support burdens, and enhance management and end-user satisfaction. This article explores the technical and operational benefits of this switch, providing insights for IT teams considering a similar transition.
The Concession Stand Context
Concession stands operate in dynamic environments where real-time data on sales, inventory, and staffing is critical. The operator, managing multiple stands across sports arenas and festivals, relied on Tableau to track key performance indicators (KPIs) like daily sales, inventory turnover, and customer wait times. However, Tableau’s licensing model, resource demands, and support requirements posed challenges for the small IT team responsible for maintaining the platform. The operator sought a solution that could deliver the same analytical power with greater cost efficiency, scalability, and ease of use.
Licensing: Cost and Flexibility
Tableau’s licensing model, based on Creator, Explorer, and Viewer roles, often requires organizations to purchase multiple licenses to accommodate different user needs. For the concession stand operator, this meant acquiring Creator licenses for IT administrators who built dashboards, Explorer licenses for managers analyzing data, and Viewer licenses for staff accessing reports. With annual costs ranging from $15 to $70 per user per month, depending on the role and edition, the total licensing expense was substantial for a business with fluctuating staff sizes. Additionally, Tableau’s requirement that all users within a deployment use the same edition limited flexibility, as mixing licenses was not permitted.
In contrast, StyleBI’s serverless dashboard microservice operates on a more flexible, usage-based licensing model. Instead of per-user licenses, StyleBI charges based on data processing and dashboard usage, which aligns well with the seasonal nature of concession operations. This allowed the operator to scale costs dynamically, paying only for active usage during peak event seasons and reducing expenses during off-periods. The IT team estimated a 30% reduction in licensing costs compared to Tableau, as they no longer needed to maintain licenses for occasional users like temporary event staff. The serverless model also eliminated the need for upfront investments in perpetual licenses, making budgeting more predictable and aligned with operational needs.
Resource Overhead: Serverless Simplicity
Tableau’s deployment, whether on Tableau Cloud or Server, required significant resource overhead. For the concession operator, running Tableau Server on-premises demanded dedicated hardware, including high-performance servers to handle data processing and visualization rendering. This setup incurred costs for server maintenance, cooling, and power, adding to the IT team’s workload. Even with Tableau Cloud, the operator faced challenges with managing resource blocks for concurrent data flows, which required careful configuration to avoid performance bottlenecks during high-traffic events like championship games.
StyleBI’s serverless architecture, built on cloud-native microservices, eliminated these concerns. By leveraging platforms like AWS Lambda, StyleBI dynamically allocates resources based on demand, removing the need for dedicated servers. The IT team no longer had to provision or maintain hardware, reducing infrastructure costs by approximately 25%. The microservice design also allowed for modular scaling, where specific components—like data ingestion or visualization rendering—could scale independently, ensuring low-latency performance during peak sales periods. For example, during a major festival, StyleBI handled a 50% spike in data queries without requiring manual intervention, a stark improvement over Tableau’s resource-intensive setup.
Support Savings: Streamlined Maintenance
Maintaining Tableau required significant IT support, particularly for on-premises deployments. The concession operator’s IT team spent hours on server updates, patch management, and troubleshooting connectivity issues with data sources like point-of-sale (POS) systems. Tableau’s advanced management features, such as Data Management and Advanced Management add-ons, added complexity and cost, requiring specialized knowledge to configure and maintain. Even with Tableau Cloud, support tickets for issues like slow query performance or integration challenges consumed valuable IT resources.
StyleBI’s serverless microservice model shifted much of the maintenance burden to the cloud provider. Routine tasks like scaling, updates, and backups were handled automatically, reducing the IT team’s support workload by an estimated 40%. The platform’s built-in connectors for common data sources, including POS systems and cloud-based inventory databases, simplified integration compared to Tableau’s more manual configuration process. When issues arose, StyleBI’s support team provided responsive assistance, often resolving queries within hours via their online portal. This streamlined support model allowed the IT team to focus on strategic tasks, such as optimizing dashboards for new KPIs, rather than firefighting technical issues.
Management Satisfaction: Enhanced Control and Insights
From a management perspective, the switch to StyleBI significantly improved operational oversight. Tableau’s dashboards, while powerful, required IT intervention to customize or update, creating delays for managers needing real-time insights during events. StyleBI’s drag-and-drop interface and self-service capabilities empowered managers to create and modify dashboards without IT support. For instance, a concessions manager could quickly build a dashboard to track per-stand sales by product category, such as beverages versus snacks, during a live event. This reduced dependency on IT by 50%, as managers could directly interact with data using intuitive filters and drill-down features.
StyleBI’s real-time data streaming also provided managers with up-to-the-minute insights, critical for making decisions like restocking high-demand items or reassigning staff to reduce wait times. The platform’s interactive visualizations, such as heatmaps showing peak sales periods, enabled managers to identify trends and act swiftly. In post-event surveys, management reported a 20% increase in satisfaction with data accessibility and usability compared to Tableau, citing the ability to make data-driven decisions without waiting for IT-generated reports.
End-User Satisfaction: Intuitive and Accessible
End-users, including concession stand staff and supervisors, found StyleBI’s interface more intuitive than Tableau’s. Tableau’s Viewer role, while functional, limited interactivity, requiring users to rely on pre-built dashboards with minimal customization options. StyleBI’s web-based, zero-client access allowed staff to view dashboards on mobile devices or tablets without installing software, a critical feature for workers on the move during events. The platform’s responsive design ensured dashboards were fully functional on iOS and Android devices, improving accessibility for staff checking inventory or sales metrics in real time.
The operator conducted an internal survey post-transition, revealing a 30% increase in end-user satisfaction. Staff appreciated StyleBI’s clean, visually appealing interface and the ability to interact with data, such as filtering sales by time of day. The platform’s annotation feature also fostered collaboration, allowing supervisors to leave comments on dashboards for staff to review, streamlining communication. For example, a supervisor could note a low inventory alert directly on the dashboard, prompting immediate action. This interactivity and ease of use reduced training time by 15 hours compared to Tableau, as staff required minimal guidance to navigate StyleBI.
Challenges and Mitigation
The transition to StyleBI was not without challenges. Initial data migration from Tableau required careful mapping of existing data sources to StyleBI’s Data Block technology. The IT team mitigated this by leveraging StyleBI’s pre-built connectors and scripting capabilities, completing the migration in two weeks. Another challenge was ensuring staff adapted to the new interface. The operator addressed this with short, targeted training sessions, emphasizing StyleBI’s drag-and-drop simplicity. These efforts ensured a smooth transition with minimal disruption to operations.