Data Discovery and Analysis Software
This is the continuation of the transcript of a Webinar hosted by InetSoft on the topic of "The Topology of the Visualization Vendor Landscape." The speaker is Abhishek Gupta, Product Manager at InetSoft.
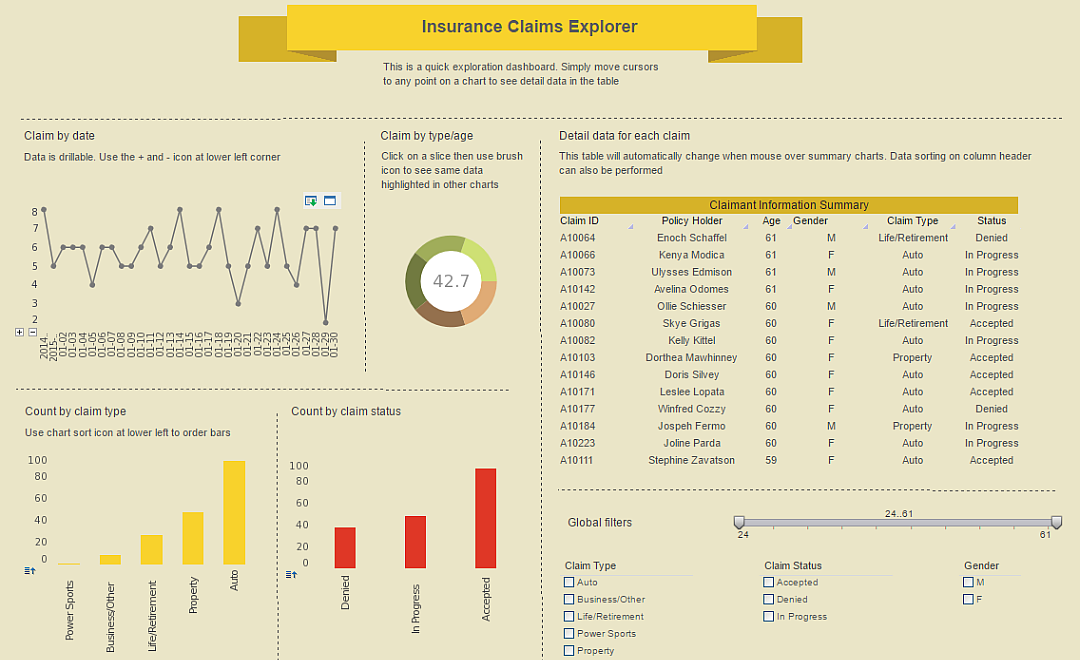
Data discovery and analysis software -- I’m going to focus the rest of this on that top right quadrant which is a big part of what we do. The concept is you connect to data source, and end users do some discovery and exploration and get insights. They see stories. They come to decisions, and then they deliver results to others in the enterprise. It could be that they deliver results out as visual chart in PowerPoint.
It could be that they deliver results as a PDF distributed out to a list of 40,000 customers. They may now want to initiate a marketing campaign and send a mailing out, too. There are additional chart types over and above the display types and the reporting kinds of charts.
There are charts that are more statistical, and there’s a lot of flexibility with data because in data discovery and analysis, it’s more ad-hoc. We can work with prepared and also unprepared data, excel spreadsheets or hundreds of source systems tables from an Oracle data warehouse.
| #1 Ranking: Read how InetSoft was rated #1 for user adoption in G2's user survey-based index | Read More |
It could be multiple tables from multiple sources, multiple kinds of relationships: one to one, one to many, and many to many. With other reporting tools, much of these data cannot has to be flattened, but you then lose a lot of the power of retaining the original multiple one to many, many to many relationships.
The tool can automatically roll-up data on the fly in-memory. Tables can be transformed into roll-up tables. There’s interaction across all for both charts and dashboards. We’d like to say you can select anywhere, and it updates all the charts everywhere, you’ll see that in our upcoming demo. And in-memory it gives you the speed that you need for this speed of thought analysis.
If you’re traversing a network to a database, asking a database to do work, it’s a lot slower than if the data is physically resident right there where the app is running. Also new field calculations, numerical strength, date and conditional formatting are part of these tools. The concept is you’re setting this up for visual discovery so people can visually explore things that human minds can see, patterns.
From there, they can drill down further and ask new questions. Included with this is predictive modeling. The idea here is the human mind can look at 5,10,or 15 fields and start figuring what’s going on by visually exploring data, but much of these data sets have 50 or 100 fields, and in some of cases it’s four, five hundred fields wide.
The human mind can’t visually tackle that. Predictive modeling determines mathematically what the five related fields are in the buckets. From there you see the pattern in a few minutes. But this is the concept of a visual tool and that display and analysis, discovery and analysis versus display or reporting.
And if you look at going beyond reporting, I love this chart. This guy Norman comes in to the room with this collection of reports and charts and things. And to the group, Norman just asks them, are we doing good, or are we doing bad? And there’s three things going on here.
First, the people in the room can’t see the story. They see a bunch of charts and numbers. The second is that this way, there are too many moving parts to easily disentangle it. The third thing is in this model you are relying on Norman. There’s a bottleneck. There’s 1% here who prepares and tries to interpret the data.
Yet, you have a group of managers trying to understand that, and at a high level this is what visualization is about. It’s taking that kind of data and making it easy to see and to interact with. I love this quote from one of our customers. “The combination of data discovery and visualization enables our users to uncover hidden relationships they didn’t know it existed.
I’ll often hear, ‘Why didn’t we have this data before?’ In fact they did have it in the report. They just didn’t see the story. And so that’s the key to visualization is getting the human mind to see and understand and create insights so they can make better decisions.
| Previous: Categories of Data Visualization Tools |
