Descriptive Analytics Examples
What Is Descriptive Analytics?
Descriptive analytics is the practice of analyzing historical data to understand what has already happened in an organization. It summarizes past performance using aggregations, trends, patterns, and visualizations such as dashboards, charts, and reports. Descriptive analytics provides the foundational layer of business intelligence by transforming raw data into clear, actionable information.
Core Purpose
The primary purpose of descriptive analytics is to help teams and decision-makers monitor performance, identify trends, and understand historical behavior. It answers the question “What happened?” and serves as the basis for deeper diagnostic, predictive, and prescriptive analytics.
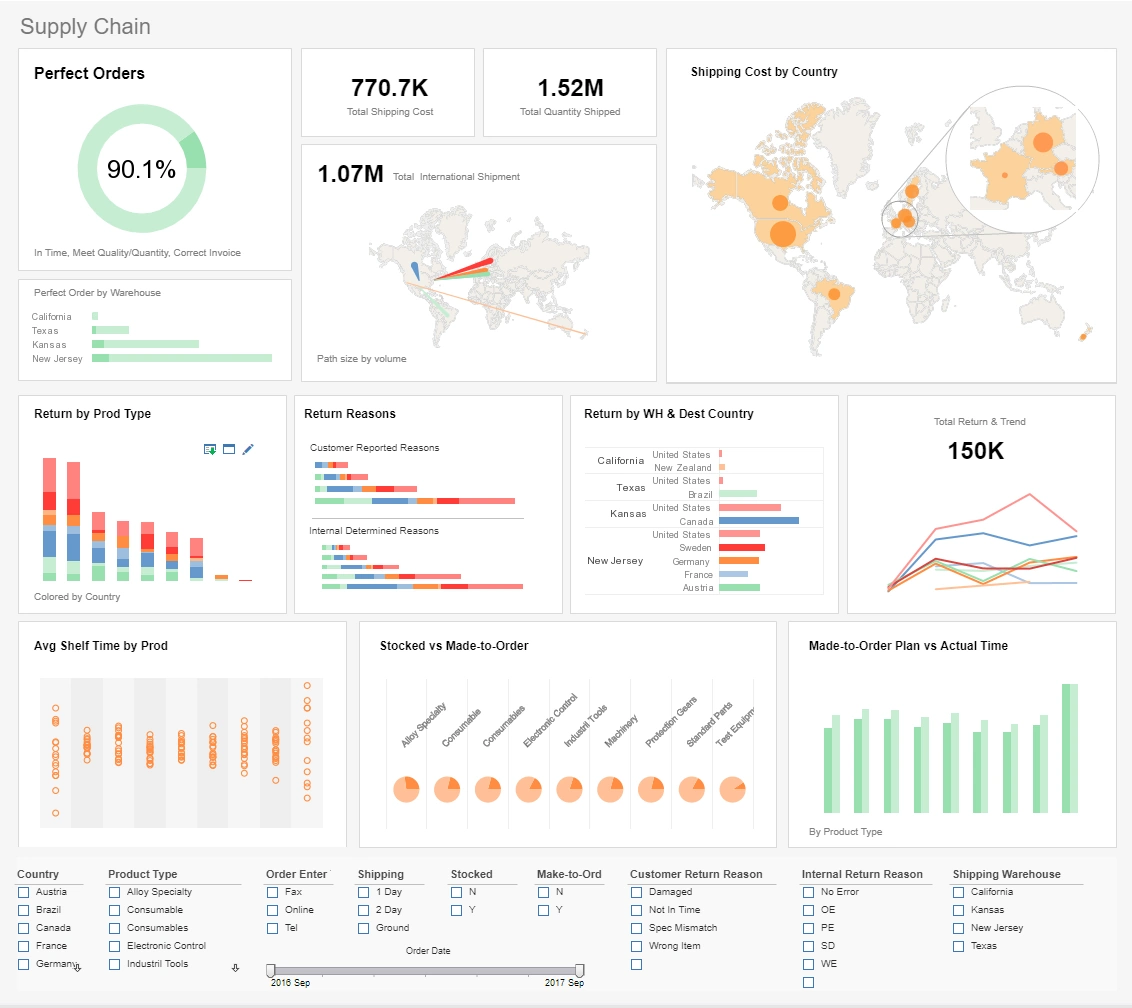

Key Capabilities
- Trend analysis — Reveals how metrics change over time.
- Aggregation — Summarizes data using totals, averages, counts, and percentages.
- Time-series summaries — Shows daily, weekly, monthly, or yearly performance.
- KPI monitoring — Tracks key performance indicators across departments.
- Data visualization — Converts raw data into charts, dashboards, and reports.
How Descriptive Analytics Differs From Other Analytics
- Descriptive — What happened?
- Diagnostic — Why did it happen?
- Predictive — What will happen next?
- Prescriptive — What should we do?
Descriptive analytics is the essential first step in understanding organizational performance and enabling data-driven decision-making.
Descriptive vs Other Types of Analytics
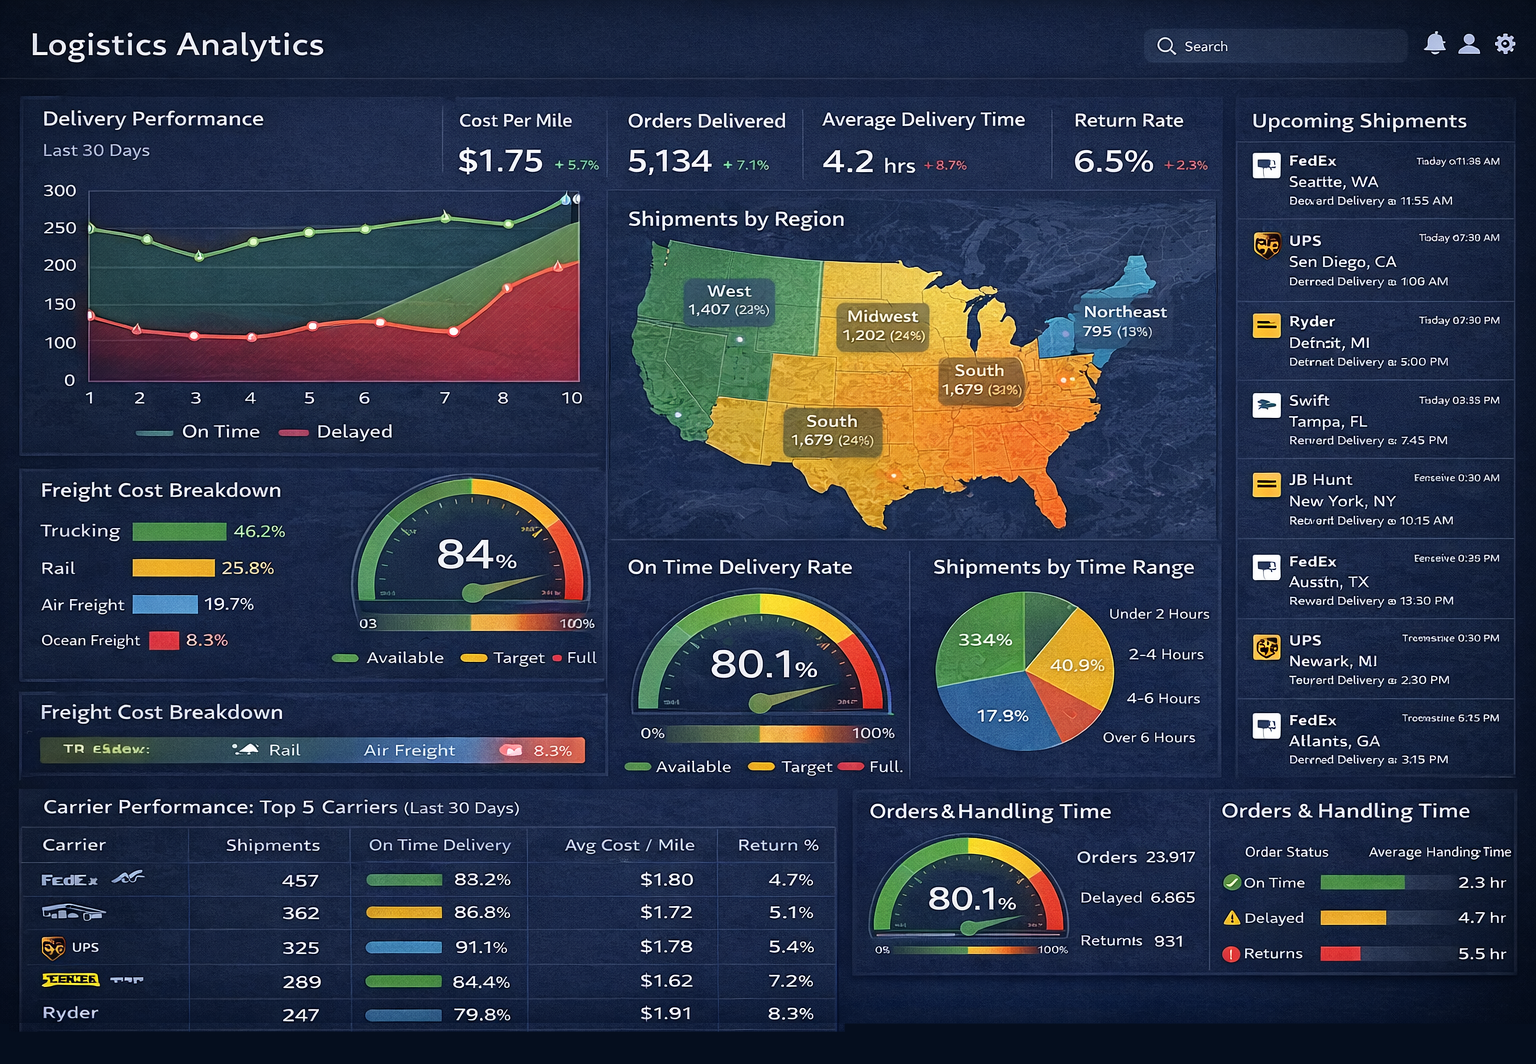
This dashboard highlights shipping performance, route efficiency, and cost trends in one view.
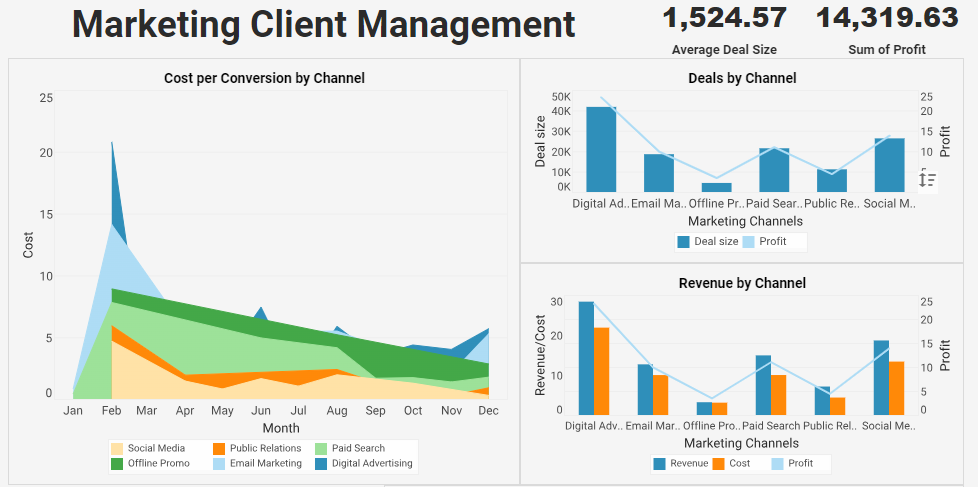
This dashboard surfaces campaign KPIs so teams can compare channels and optimize spend.
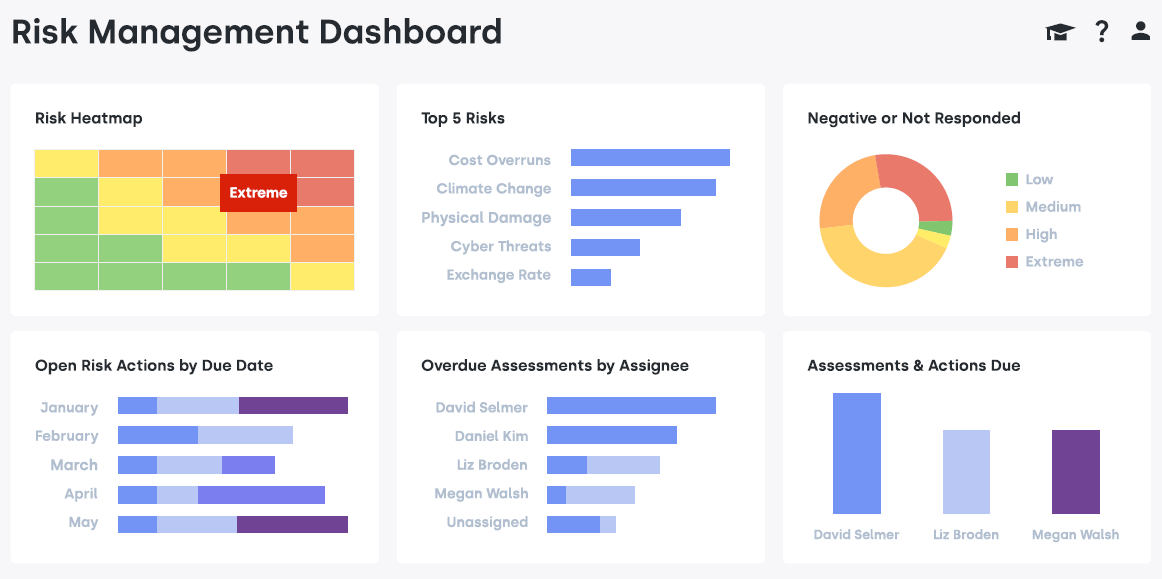
This dashboard tracks risk indicators and alert thresholds to support faster response decisions.
Predict and Influence Customer Behavior
One of the best examples of companies using business intelligence tools to impact customer behavior is Starbucks. Data is key to the company's success, and job postings it publishes demonstrate how serious these folks are when it comes to data analysis.
For example, this Starbucks' data scientist job posting from LinkedIn has a long and impressive list of analytics-related experience requirements, take a look.
Machine Learning And Data Product Dev And Deployment
- Under direction of more senior data scientists, contribute to AI and Machine Learning models in batch, real-time
- Develop data pipelines and scalable Restful APIs to create and enable analytical applications
Statistics And Model Development And Deployment
- Leverage the latest cloud technologies, existing and emerging statistical and machine learning techniques to identify data patterns and trends to solve business problems
- With support from more senior data and decision scientists, build and deploy customer segments to facilitate optimal marketing targeting within channels
- Via a "feature factory" approach, build large numbers of weak learners in a Customer 360 framework
Insights Operationalization
- Under the guidance of more senior data scientists, create clear and concise packaging and presentation of
data products and insights to business stakeholders, leaders and the broader analytics community
Data Science Evangelism
- With support from more senior data scientists, establish and foster close collaboration between data and decision scientists, engineers, business and leadership teams to align on technical roadmaps for innovation
- Establish brand and team as subject matter experts and trusted advisors for Analytics across departments
How about that for a daily to-do list?
The person hired for this job has a lot of work at their hands, but it's clear that they will be making a world of difference for the company.
Descriptive Analytics FAQ
What is descriptive analytics?
Descriptive analytics is the process of analyzing historical data to understand what has already happened. It summarizes past performance using trends, patterns, aggregations, and visualizations such as dashboards and reports.
What questions does descriptive analytics answer?
Descriptive analytics answers the question “What happened?” by providing clear summaries of historical activity, performance, and behavior across an organization.
How is descriptive analytics used in business?
Businesses use descriptive analytics to monitor KPIs, track trends, evaluate performance, generate monthly or quarterly reports, and support data-driven decision-making across departments.
What techniques are commonly used in descriptive analytics?
Common techniques include data aggregation, trend analysis, time-series summaries, pivot tables, dashboards, scorecards, and visualizations such as bar charts, line charts, heatmaps, and histograms.
How does descriptive analytics differ from other types of analytics?
Descriptive analytics focuses on summarizing past events. Diagnostic analytics explains why those events occurred. Predictive analytics forecasts future outcomes. Prescriptive analytics recommends actions to optimize results.
What types of data are used in descriptive analytics?
Descriptive analytics uses historical data from operational systems, sales platforms, financial systems, HR databases, manufacturing systems, and customer interactions.
What are examples of descriptive analytics?
Examples include monthly sales reports, production output summaries, enrollment dashboards, inventory level tracking, customer segmentation summaries, and financial performance scorecards.
Why is descriptive analytics important?
Descriptive analytics provides the foundation for all other analytics. It helps organizations understand their past performance, identify trends, monitor KPIs, and make informed decisions based on reliable historical data.
Which industries rely on descriptive analytics?
Descriptive analytics is used across manufacturing, retail, healthcare, finance, higher education, supply chain, government, and service industries to monitor performance and understand historical trends.
Can descriptive analytics support real-time monitoring?
Yes. Although descriptive analytics focuses on historical data, many dashboards refresh continuously, allowing teams to monitor near real-time performance and respond quickly to emerging trends.