Do You Have a Self-Service BI Solution?
This is a continuation of the transcipt of a Webinar hosted by InetSoft. The speaker is Mark Flaherty, CMO at InetSoft, and he discusses the topic of “Embedded Business Intelligence”
Can you answer most of your ad hoc business performance questions on your own? Or do you need to ask IT for a new report each time you have a question?
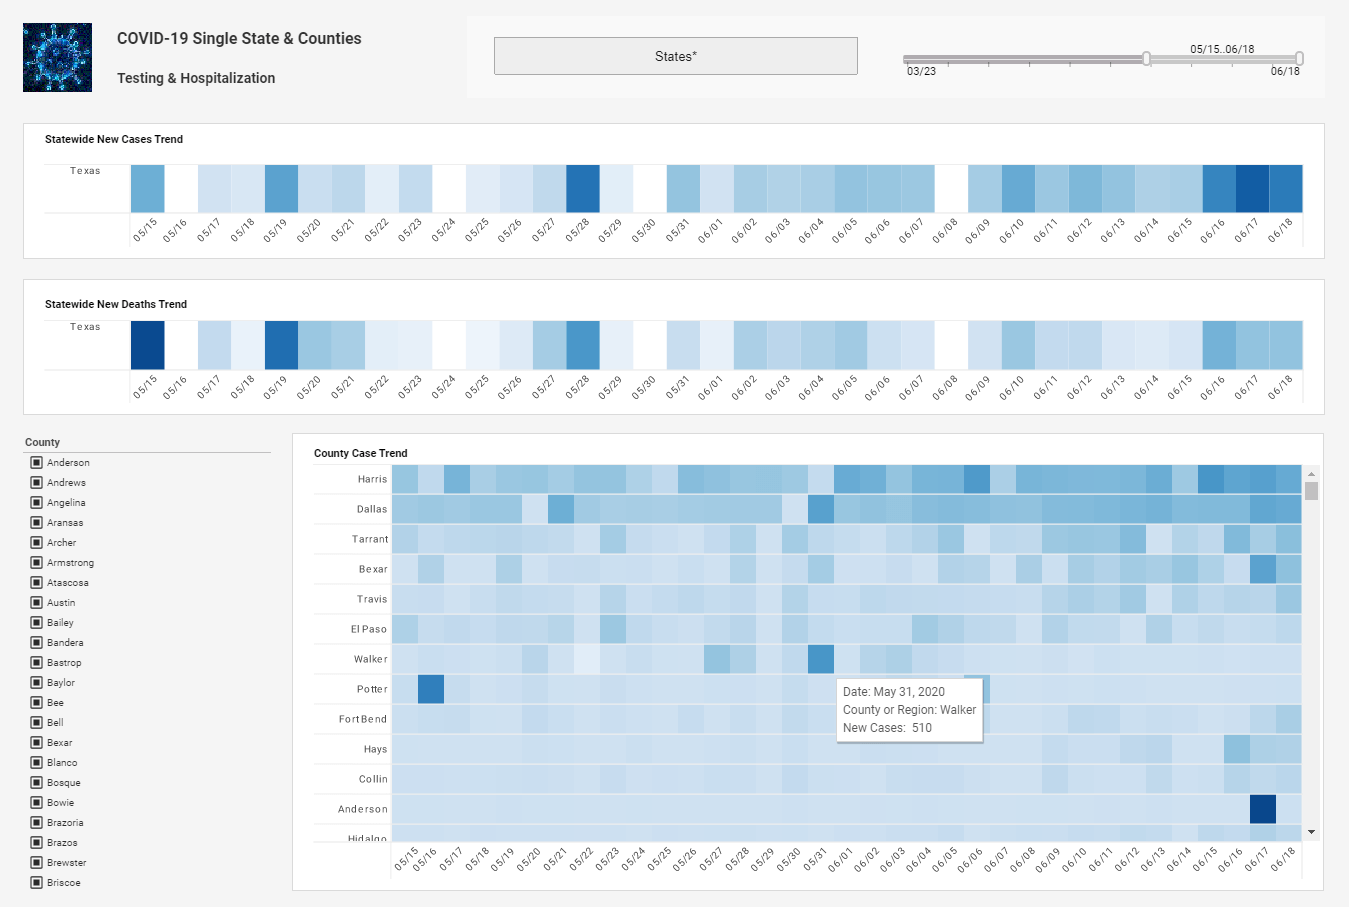
You need a self-service BI solution like InetSoft's StyleBI. With a few hours of setup by an IT person knowledgeable about your databases, you can use an intuitive drag-and-drop dashboard designer to make simple or advanced visualizations of your company's performance data.
Interactive analysis controls like selection lists and range sliders turn static charts into data exploration tools for maximum self-service.
Diatomaceous Earth Mining Meets StyleBI
Learn how diatomaceous earth mining enterprises can deploy StyleBI to track critical industry-specific KPIs, craft intuitive dashboards, and deliver actionable reports—all in a cloud-native microservices container, with minimal dependencies and full control.
Why StyleBI Fits Diatomaceous Earth Mining
- Open‑source, small‑footprint deployment: StyleBI Open Source can be containerized via Docker—ideal for remote mining sites or edge environments with modest compute capacity.
- Data mashup engine: DE mining operations often wrangle geology lab results, extraction sensor telemetry, equipment logs, and environmental monitoring data. StyleBI’s mashup pipeline enables seamless integration of these disparate sources into analytic-ready "data blocks."
- Self‑service analytics: IT can design base dashboards or data models, while geologists or operations managers without SQL skills can self‑serve insights via drag‑and‑drop charts, intuitive filtering, and interactive views.
Key Performance Indicators (KPIs) for DE Mining
Below are essential KPIs that DE mining professionals should track, organized into operational, safety, environmental, and financial focus areas:
- Extraction Yield: Ratio of mined DE mass versus estimated deposit volume, measured daily.
- Processing Recovery Rate: Percentage of DE retained after milling, sifting, and drying processes.
- Equipment Uptime: Percentage of operation time that critical machinery remains online, with breakdown incidents flagged.
- Particle Size Distribution: Percentage breakdown—e.g., <2 μm vs 2–20 μm—tracked to quality benchmarks.
- Energy Consumption per Ton: kWh used per ton of DE processed.
- Dust Emission Levels: PM10/PM2.5 readings at designated sampling points, compared to regulatory thresholds.
- Labor Efficiency: Tons processed per labor hour in each shift.
- Inventory Turnover: Days of stock on hand versus shipping schedule.
- Cost per Ton: Total operational cost allocated per ton of DE produced.
- Compliance Events: Count of environmental or safety alerts per period.
Dashboard and Report Examples in StyleBI
1. Daily Operations Overview
A composite dashboard featuring:
- Gauge charts for Extraction Yield and Processing Recovery Rate—real-time visuals that highlight performance against yield thresholds.
- Sparkline trend line tracking Equipment Uptime over the past 30 days, with markers for recent shutdown events.
- Bar chart comparing Energy Consumption per Ton across processing lines.
- Heatmap of Particle Size Distribution, with cells color‑coded for percentage ranges.
These components are built through StyleBI’s drag‑and‑drop designer; interactive filters let users segment by shift, mining zone, or equipment batch. Self‑service tooling means users can customize filters or re‑slice data without IT.
2. Environmental Compliance and Safety Report
- Line chart showing PM10 and PM2.5 levels over time, with bands highlighting compliance thresholds.
- Table with conditional formatting listing Compliance Events by date, severity, location, and action required.
- Geo‑map overlaying sampling monitor locations, with colored markers indicating current dust levels.
Users can schedule this as a paginated PDF, or deliver it to email subscribers weekly. Analysts can drill down by site or shift. StyleBI’s map components can integrate with Google Maps or lightweight shape maps, enhancing spatial understanding.
3. Cost & Productivity Scorecard
- Crosstab pivot table showing Cost per Ton and Labor Efficiency broken down by shift and day. Includes intercell formulas—e.g., cost divided by hours—to surface derived metrics inline.
- Stacked bar chart presenting Inventory Turnover versus Output Volume across product grades or storage silos.
- Bullet chart for Cost per Ton performance: target versus actual embedded performance ranges.
With StyleBI’s Freehand Table and correlated grids, operations managers can highlight month‑end performance and compare actuals to budget. The real‑time mashup engine ensures that this data remains current without IT intervention.
Design and Technical Implementation Considerations
Deployment: Run StyleBI Open Source in Docker containers on-premises or in cloud. Typical footprint: 2 cores, 4 GB RAM. IT can embed it into broader microservices architecture or deploy on edge single‑node appliances.
Data Integration: Pull data from sources such as SQL databases (for lab results), REST APIs (sensor data), file shares (CSV exports), and ERP systems (cost, labor, inventory). Mashups unify them into analytic blocks for dashboards and reports.
Security and Access Controls: StyleBI offers granular RBAC, so IT can assign dashboard edit rights to analysts, consumption-only rights to managers, and mapping-based filters for site-level data visibility.
High Performance: Data Blocks can be cached and accelerated in-memory. For large data scenarios (e.g., multi-site telemetry), StyleBI can integrate with Spark clusters to scale analytics.
Self‑service & Extensibility: Power users design dashboards; non‑technical staff add filters or visual tweaks. Developers can extend via built‑in scripting API or custom D3-based chart types, embeddable as web components if needed.
Putting It All Together: Benefits for IT and Operations
For IT teams in DE mining operations, StyleBI streamlines analytics architecture by collapsing ETL, data modeling, and dashboarding into one web interface. There's minimal overhead—no heavy BI servers or licensing fuss, only agile BI in a lightweight Docker container. Integration with existing enterprise systems via Java‑based architecture keeps it flexible and embed‑friendly.
On the operations side, dashboards and visual cues let engineers, geologists, safety officers, and executives interact with live data at their pace. Extraction efficiency issues, environmental alerts, productivity anomalies are highlighted early. KPIs from recovery rate to cost per ton are accessible via self‑service visuals rather than static reports, fostering a culture of transparency and continuous improvement.

