Dashboards are the Easiest to Use BI Tools
This is the continuation of the transcript of a Webinar hosted by InetSoft on the topic of "Why You Need Data Discovery Software." The speaker is Abhishek Gupta, product manager at InetSoft.
Back on the end of easy to use BI tools, you have more of a search driven interface which is very exploratory and allows for a minimal level of analytics, but it is extremely accessible. There is another type of interface that our customers use which is an interactive dashboard.
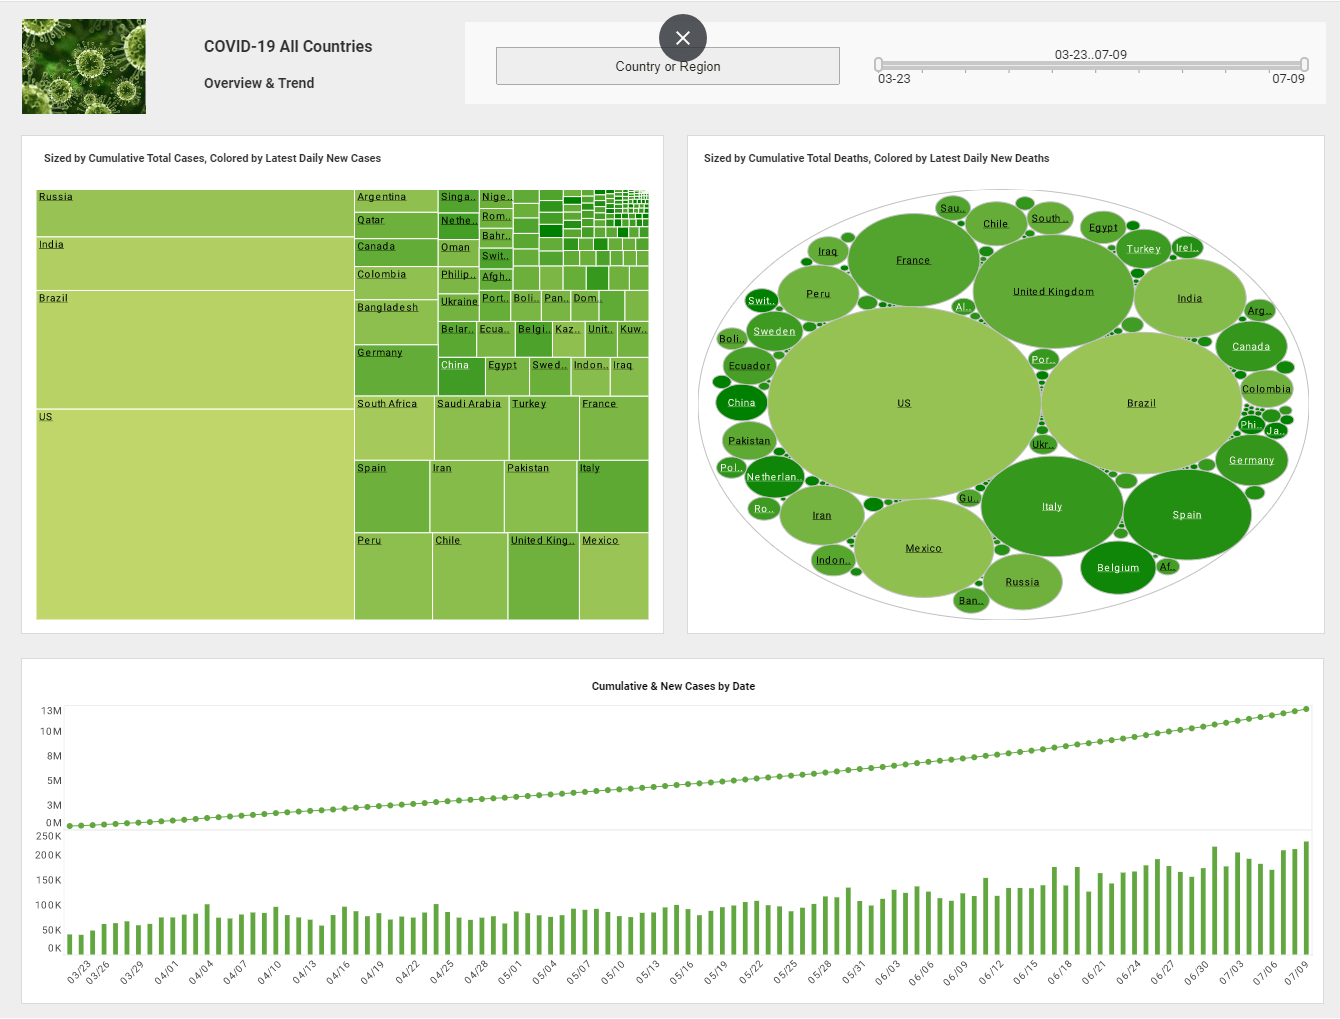
An interactive dashboard is basically taking a dashboard which is one of the easiest most digestible forms of information in the BI realm and adding self-service access through a keyword search box with fast navigation. Some of those modes are borrowed from the search world.
You really get a kind of a managed simple self-service experience. When you have a BI platform the best case supports this broad spectrum of access modes. So I’ll get to that little bit later on the discussion.
The principle user of a BI system is a nontechnical user. But these users do have business process acumen. So often times they’re aware of the types of data that’s available, but they’re not necessarily fluent or cognizant of the language necessary to manipulate it. So if you look at visual tools there’s that bridge that crosses the chasm from not being able to understand access to that information.
| #1 Ranking: Read how InetSoft was rated #1 for user adoption in G2's user survey-based index | Read More |
Visual BI Tools Bridge the Gap
Otherwise it is obfuscated by SQL statements or high level development languages or even low level development languages. These visual tools are that bridge. So to define these business processes in visual readable terms rather than drive it as machine languages, you will certainly put yourself in any place where that self-directed access, that exploratory process becomes much more fluid, much more rapid, much more ingrained in everyday activities for the business.
Traditionally the developer is really good at the form of the data, and they’re not the experts in the content of the data. You have business users who are all about the content. They know what that data means. They know their business processes, and yet they don’t know how to extract meaning from the data because they don’t know the form of it.
They don’t know how to get it into a form they can use. And so there has been this chasm between the form people, the people who know the form and the people who know the content. And these visual tools help across that chasm and create some unity there that just brings additional power to the business. So that’s a real good point.
Let’s move to this next point in the checklist that I want to discuss, putting users on a fast path to information insight. To the fastest belong to the spoils. Poor information prevents organizations for being first to market with new products and services. Marketing functions are increasingly important. If organizations have to wait months, if they wait for IT development processes, that’s bad.
So I think organizations begin to see really to business cost of users waiting for information and see the need to get away from the legacy of tools only nontechnical users could use. And then we’ll talk about the importance of nontraditional and structured information in the decision making process. Then finally how important are some things like dashboards to pull together information and make it more visible.
I think it’s easy for us to maybe vilify the IT organization. Their hands are tied in a number of ways, privacy restrictions, and security concerns. Software and hardware support, that’s their domain. That’s where they need to play. But providing tools that enable users while at the same time addressing the concerns of an IT organization are incredibly important.
So if we take the fact that IT organization operates more like a facilitator, IT organizations really do want what’s best for you as the organization. They watch out for regulatory issues, security, and access. At least from our perspective IT has been that kind of that middle ground where they want to facilitate. They want to actually enable users to get access of the information that they need to make things move forward.
So they want to deliver tools that facilitate the BI process. A support organization can meet the needs of those users. They can essentially accelerate that whole business insight process, right. So you’ve now taken one element of the processes with generally some form of obstruction and turn them into a facilitator and enabler for that BPO, the Business Process Optimization.
| Previous: Best Practice Report About Self Service Business Intelligence |


