InetSoft's Hospital Dashboard Product
The management of hospitals, clinics, and independent healthcare providers all involve tracking factors such as patient complaints, nurse and employee turnover rates, and more. When using basic office programs like Excel or database software, processes of analysis are often cumbersome and prone to human error.
The answer for healthcare organizations is adapting a business intelligence software that can meet all visual analytic needs through dashboards and reports, without having to rely on a professional analyst or spending copious amount of money on IT setup.
InetSoft's Style Scope, an edition of InetSoft's StyleBI that primarily focuses on visual analysis and data monitoring, with real-time reporting capabilities, is the ideal solution for healthcare providers in need of visualizations and monitoring dashboards.
Along with having a significantly lower entry point than other visualization providers, such as Tableau, Style Scope™s intuitive and robust software allows nontechnical users to create dynamic and interactive dashboards perfect for any healthcare oriented organization.
Cost and Features Comparison for a Dashboard for Hospital Management
When it comes to comparing costs in dashboard products, all of InetSoft's products hold a much lower entry point than other business analytics providers (such as Tableau). InetSoft's smallest package of five user licenses costs less than $600 per license.
Tableau and similar vendors begin their services at almost $1,000 per license, a typical starting price point for the business intelligence industry. Thus, InetSoft's yearly cost is nearly half of most dashboard software providers, allowing hospitals to utilize professional, high-quality dashboarding and visualizations without going over budget.
However, what truly separates InetSoft from its competitors are the differences in versatility. All of InetSoft's products, including Style Scope, are Java and web-based applications, compatible with any operating system and any web accessible device. Not only is Style Scope accessible on smartphones and tablets, it also does not require a large, client download; its end users only need a web browser. On the other hand, most other BI vendors (including Tableau) are Windows-based and require users to download software onto each device to access dashboards.
Style Scope’s Dashboarding Features
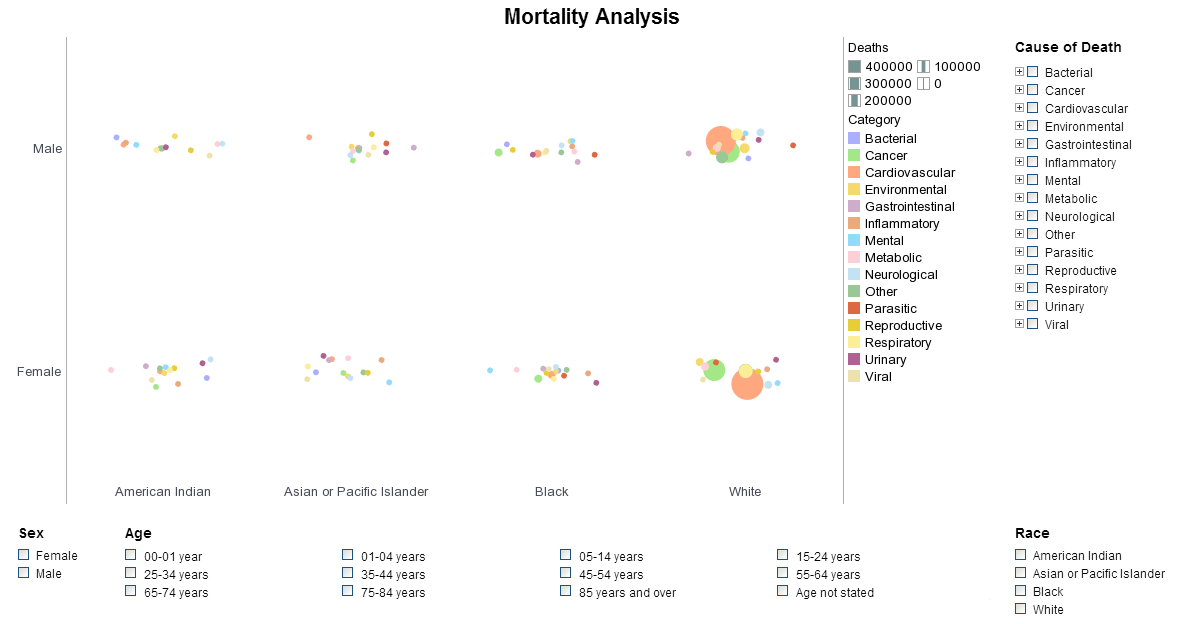
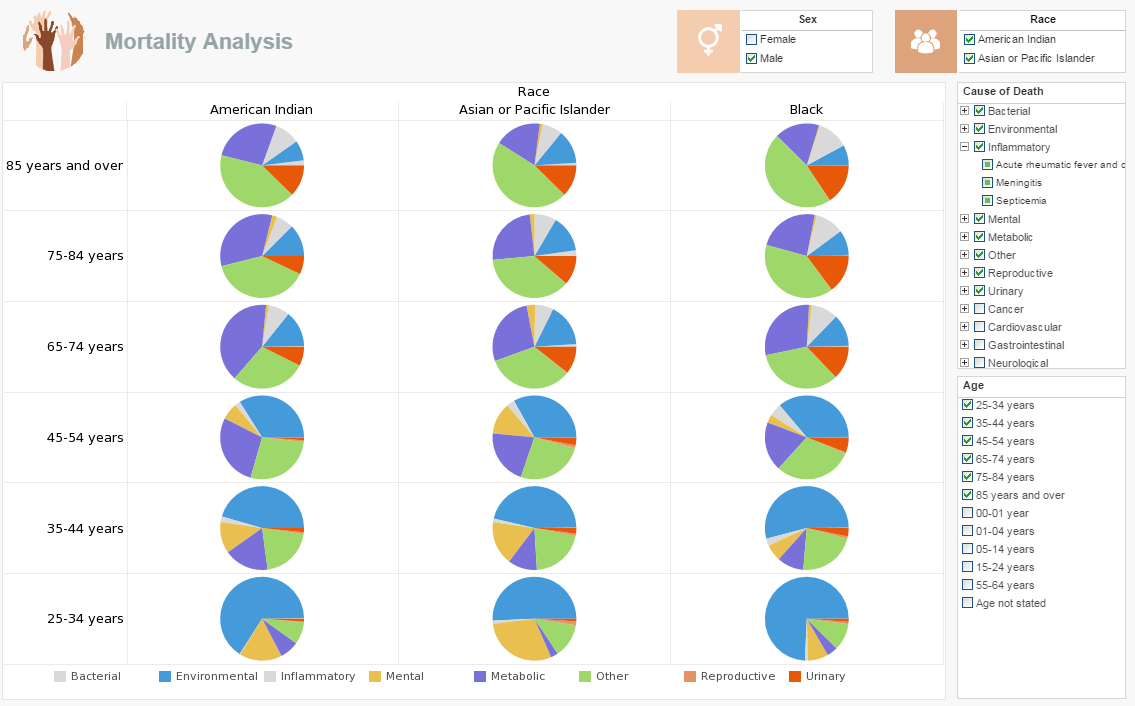
Style Scope offers various dashboarding and reporting options for organizations to create and build a wide range of visual analytics. Scope's features include the ability to create multi-dimensional charts, where users can make charts or graphs with measures in a variety of ways, including size, shape and color. This kind of multi-dimensional charting is perfect for clinicians that want visualizations which display several different metrics at once, such as hospital admissions per year, the average length of stay and average patient discharge rates, or any other metrics that involve a multitude of factors.
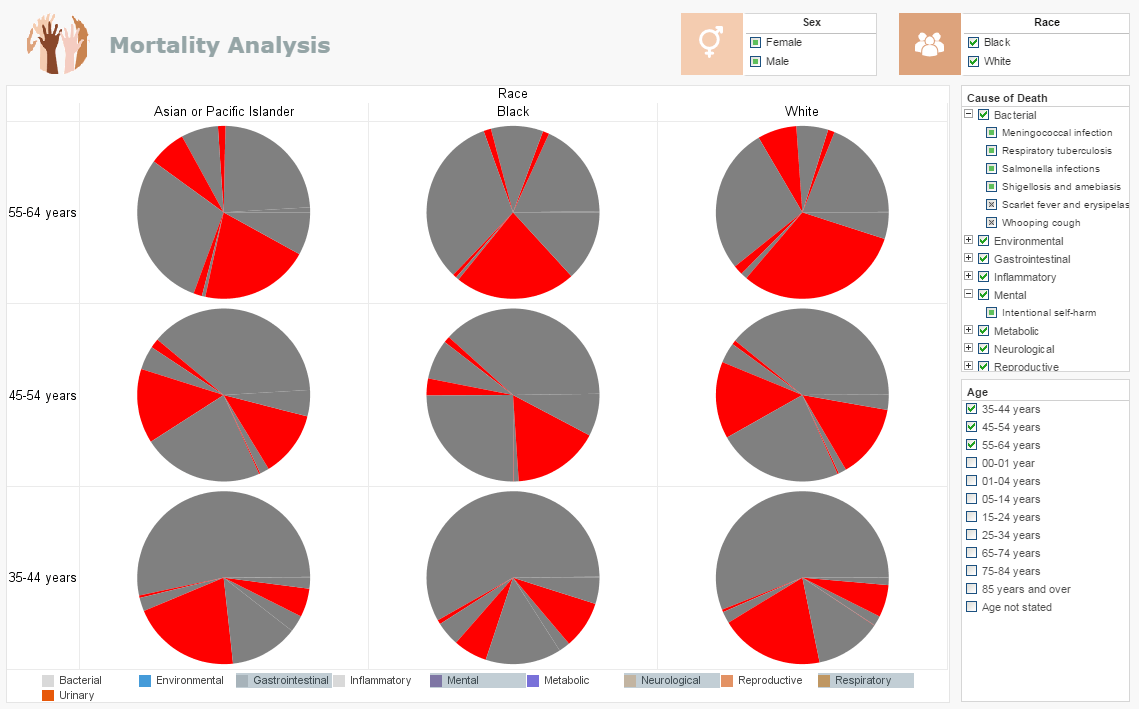
Style Scope also has a variety of drilldown functionalities, for further exploring data. Drilldown allows users to access information associated with a specific report element on any dashboard or report, going as far as extracting raw data that matches a certain query. Drilldown is well suited for healthcare providers, since it can allow clinicians or doctors to pull out specified and detailed data of any variable from any interactive dashboard or report. For example, on an ER waiting time dashboard, a user viewing the average waiting time for patients to see a doctor could select instances in which wait times were above a certain threshold, and Style Scope would immediately bring up data in a spreadsheet format, so doctors or managers could investigate the individual cases during which wait times were at unacceptable length.
Outside of dashboarding and reporting elements, Style Scope fulfills the need for data security, which is extremely necessary for hospitals since patient files are HIPAA protected and any breach can lead to legal liabilities. Style Scope™s security model provides data security that is highly adaptable and configurable, in that care centers can import existing users, groups or roles from a database or LDAP server without having to reformat or manually enter them within InetSoft's software. The convenience of importing any existing users from a previous database, as well as the ability to set permissions by user, group, or data set, gives hospitals the confidence in knowing that their data will be secure within Style Scope.
Key KPIs for Surgery/Operating Room Management Dashboards
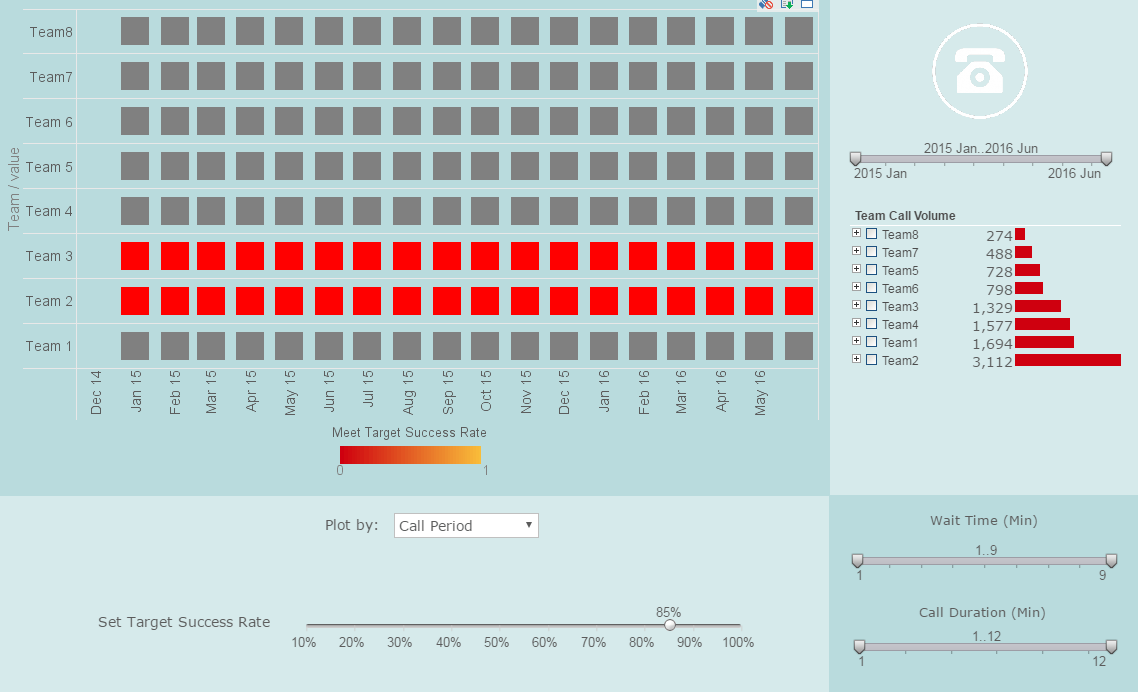
Effective OR management is equal parts logistics, finance, and patient safety. A strong dashboard balances throughput metrics with quality and cost signals, so leaders can trade precision for speed only when it’s safe and economically rational. Below are the KPIs that consistently earn their spot on a high-signal Surgery/OR dashboard, plus what they tell you and how to act on them.
Throughput & Scheduling Efficiency
- OR Utilization (%): Time in use divided by total staffed time. Aim for a healthy middle—chronically low suggests excess capacity, chronically high creates delays and burnout. Slice by room, service line, and day of week.
- Block Utilization (%): Portion of allocated block time actually used by a surgeon/service. Low values justify block reallocation; high values support expansion or case-length tuning.
- On-Time First Case Starts (%): The day’s tone-setter. Track primary drivers (patient readiness, surgeon punctuality, instrument availability, anesthesia induction).
- Turnover Time (min): Wheels-out to wheels-in. Pair the mean with the 90th percentile; outliers are where capacity hides.
- Cancellation Rate (%): By cause (patient factors, medical clearance, insurance, equipment, staffing). Same-day cancellations are the costliest; build early warning flags.
- Case Duration Variance: Actual vs. scheduled minutes. Persistent bias by surgeon or procedure signals the need to recalibrate templated times.
Clinical Quality & Safety
- Surgical Site Infection Rate: Risk-adjusted and trended. A small bump warrants a line-item review of antibiotic timing, normothermia, and sterilization practices.
- Adverse Event Rate: Includes unplanned returns to OR, anesthesia complications, wrong-site near misses. Pair rates with root-cause closeout percentages.
- Flash Sterilization/Immediate-Use Steam Sterilization (%): A helpful proxy for instrument set readiness and case cart accuracy.
- PACU Boarding Time: Minutes patients wait for an inpatient bed. High values back up the entire OR and inflate overtime.
Cost & Productivity
- Cost per Case: Direct supplies, implants, and labor. Benchmark by procedure; drill into top variance drivers.
- Supply/Implant Cost Variance: Actual vs. preference card standard. Standardization opportunities often live here.
- Labor Productivity: Cases or hours per FTE, overtime hours, and agency usage. Persistent overtime usually traces to schedule granularity or PACU bottlenecks.
- Revenue (or Margin) per OR Hour: The north-star economic metric; combine with utilization to prioritize add-on cases.
Experience & Capacity Signals
- Surgeon Satisfaction / Access Score: Perception of scheduling fairness, add-on case access, and turnover reliability influences case retention.
- Patient Experience (NPS/CAT): From pre-op communication to post-op pain control; lagging but essential.
- Case Mix Index (CMI): Context for acuity and expected resource use; important when comparing rooms or days.
How to Use These KPIs
KPIs should drive action, not just decorate a wall. Pair each metric with an owner and a lever. For example, if on-time first case starts dip, auto-page a pre-op readiness checklist 60 minutes prior, and surface a heat map of missing labs or consents by clinic. If turnover time spikes, run a Gemba-style breakdown of tasks by role, then pilot parallel processing (cleaning and setup overlap) in the two worst-performing rooms. For case duration variance, retrain the scheduling model quarterly using recent actuals and flag surgeons with systematic optimism bias. When PACU boarding grows, the lever is rarely in the OR; escalate bed management and forecast discharges earlier on the inpatient units.
Design Opinions That Improve Signal
- Show both mean and 90th percentile for time metrics; the tail is where delays live.
- Color code by controllability (green: controllable today; amber: shared; gray: external) to focus huddles.
- Make exceptions first-class: a live list of late cases, missing instruments, or pending clearances beats a pretty gauge.
In short, a high-trust OR dashboard blends utilization, punctuality, quality, and cost into a single operational story—with explicit owners and playbooks. When those elements come together, management can add cases without adding rooms, reduce overtime without eroding quality, and keep surgeons and patients equally satisfied.
