Manufacturing Metrics KPI Dashboard
Manufacturing processes generate volumes of data that must be monitored and analyzed for peak performance and efficiency. By observing and analyzing these processes, companies can gain an understanding of the different shifts and trends which progress and hinder their business. This knowledge provides managers with great insight to act accordingly and make decisions in a confident manner.
What do production managers need? The answer is a manufacturing metrics kpi dashboard to graphically represent the status of each phase of the manufacturing process. InetSoft's StyleBI offers informative dashboard displays using various elements, including charts, tables, diagrams, spreadsheets, etc., which are highly interactive and easily deployed.
Using performance data and metrics within a company, InetSoft's production dashboard operates to measure business performance, enabling project managers to face any challenges with ease.

InetSoft's Advantages
InetSoft's StyleBI software offers an easy-to-deploy, and even easier-to-use solution. Designed with accessibility in mind, businesses can easily adopt this solution.
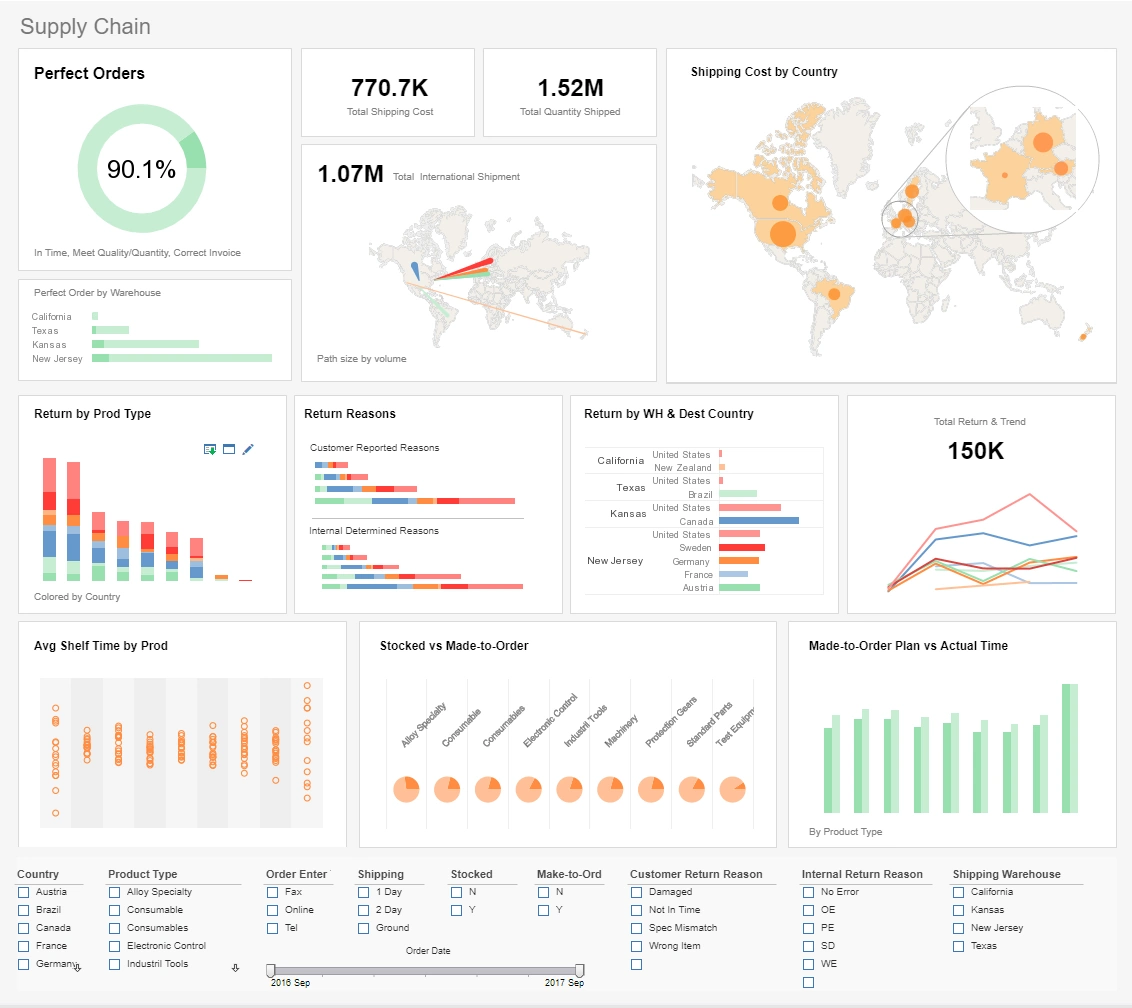
This sample manufacturing dashboard enables the production manager to track the following KPIs:
- Number of goods being produced without error
- Delays caused by machine downtime
- Errors caused by workers
Whereas an executive of the company can:
- View summation statistics of company profits
- Find out who are the major customers
- Review safety procedures by measuring worker injuries
With InetSoft's manufacturing and production dashboard, companies can manage and audit the manufacturing process. Workers and managers have the ability to communicate and monitor their activity, as well as receive real-time alerts of under-performance or deviations from plans. Businesses have the advantage of developing and progressing confidently knowing they are on the right path.
Bespoke Bellows Maker Moves from Global Shop Solutions to InetSoft for Manufacturing Metrics KPI Dashboards
Global Shop Solutions is excellent at transactional workflow: jobs, routing, labor capture, and MRP. But many of BellowWorks’ critical signals live outside strict ERP transactions. Their weld jig vibration logs, pneumatic burst-test telemetry, bench-level SPC sheets, and operator time-and-motion annotations sit in a mix of files, PLC logs, and a separate quality database. When management tried to answer questions like “Which custom flange geometry is causing the most rework?” or “How does operator A’s cycle time compare across three fixture layouts?” the team stitched together Excel exports, PowerPoint slides, and tribal notes. Reports required manual reconciliation and often arrived after the week’s production was finished—too late to influence outcomes. The result was reactive firefighting rather than predictive improvement.
InetSoft as the Manufacturing Metrics Layer
BellowWorks kept Global Shop as the system of record for transactional data, but adopted InetSoft to become the analytics system of action. InetSoft’s data mashup capabilities allowed the company to join ERP work-order status with MES cycle-time logs, QC failure-trend tables, PLC burst-test peaks, and even Google Sheets used by the finishing team. Suddenly, KPIs were not static slide decks but live, drillable dashboards fed by multiple authoritative sources.
Key Dashboards and KPIs They Built
The first 90 days focused on metrics that directly changed daily decision-making:
- OEE (Overall Equipment Effectiveness): Calculated using live cycle time from the MES, planned production time from Global Shop, and quality rejects from the QC system.
- First Pass Yield (FPY): Tracked at the operation and job level, with drill-down to material lot and tooling configuration.
- Process Stability (SPC): Real-time control charts for key dimensions captured by digital calipers and laser gauging stations.
- Throughput & Lead Time: End-to-end job flow visualized on a Kanban-style board with ETA variance colored by supplier lead-time risk.
- Rework Cost & Scrap: Financial overlay tying rework hours to burdened labor cost and material scrap, so engineering changes could be prioritized by ROI.
- Preventive Maintenance Alerts: Trending vibration and air-pressure drift from fixtures to predict maintenance before accuracy drifts.
How the Mashup Worked (Practically Speaking)
The technical team created a small set of governed views in InetSoft’s mashup layer:
- Join Global Shop work orders to MES cycle records on Job ID and Operation ID.
- Blend QC test results by lot number and job serial, normalizing timestamps and units.
- Append PLC telemetry as time-series slices and compute rolling aggregate features (peak-to-peak, mean pressure, etc.).
- Create calculated KPIs—OEE components, FPY, cost-per-rework—and expose them as reusable metrics for dashboards and alerts.
By centralizing the business logic in InetSoft, everyone used the same definitions. The production foreman’s “uptime” matched the CFO’s “productive time” because both were computed from the same mashup.
Change Management: Making the New Dashboards Stick
BellowWorks didn’t try to boil the ocean. They piloted with three lines and one cross-functional metric—FPY by job family—which had immediate financial impact. Two cultural moves mattered:
- Guardrails, not handcuffs: They kept Global Shop as the transactional workflow and allowed operators to continue using their preferred tools. InetSoft only read the data and computed the metrics—edits stayed with the source systems.
- Safe red policy: Leadership publicly rewarded early, data-backed escalation. If an operation turned red because the SPC failed, the operator was applauded for catching it early and given support to fix the fixture.
Training sessions focused on interpretation—how to read a control chart, how to use drill paths to find root cause, and how to convert a dashboard insight into a corrective task in Global Shop. They even built a small “playbook” linked from the dashboard: click a red metric and see the four steps to investigate and contain.
Business Outcomes
Within six months, BellowWorks saw measurable improvements: FPY increased by double digits on pilot lines, scrap costs dropped as SPC caught drifting processes earlier, and lead-time variance fell because supplier issues were visible in procurement-triggered dashboards. Equally important, weekly production meetings shifted tone—from finger-pointing slide reviews to rapid problem solving using the live dashboard as the single source of truth.
Why This Pattern Works for Obscure “Be” Manufacturers
Manufacturers of specialized mechanical assemblies—bellows, beryllium-copper springs, bespoke expansion joints—share a few traits: small batch sizes, high customization, and sensitivity to process nuance. They benefit more from composable analytics that bring together heterogeneous signals than from heavier restructuring of ERP systems. InetSoft’s ability to mashup transactional ERP records with time-series process data and human-entered QC notes is a pragmatic fit: it makes the invisible visible without breaking the systems that already work.
Playbook to Replicate BellowWorks’ Success
If you’re in a similar niche and using Global Shop (or another ERP), consider this approach:
- Start with one operational KPI that ties to cost (e.g., FPY or scrap dollars).
- Map the minimal set of sources needed to compute it and build governed views.
- Expose dashboards to the people who can act—in the shop, not just in finance.
- Close the loop by pushing decisions back into your ERP as taskable work orders.
- Celebrate early escalations and make “red” an opportunity for support, not punishment.
For BellowWorks, switching the analytics layer to InetSoft didn’t mean abandoning Global Shop Solutions; it meant giving their artisan-led manufacturing the data infrastructure it needed to scale with confidence. And for any obscure “Be” manufacturer whose value lives in nuance, that’s a pragmatic, high-impact move.
