Marketing Reporting Tools
Marketing reporting tools are crucial for analyzing a marketing department's leads, progress, and traffic.
Software is particularly useful to marketing professionals when it comes to measuring the effectiveness of digital marketing campaigns, tracking the performance of blog posts, external website links, and search engine rankings.
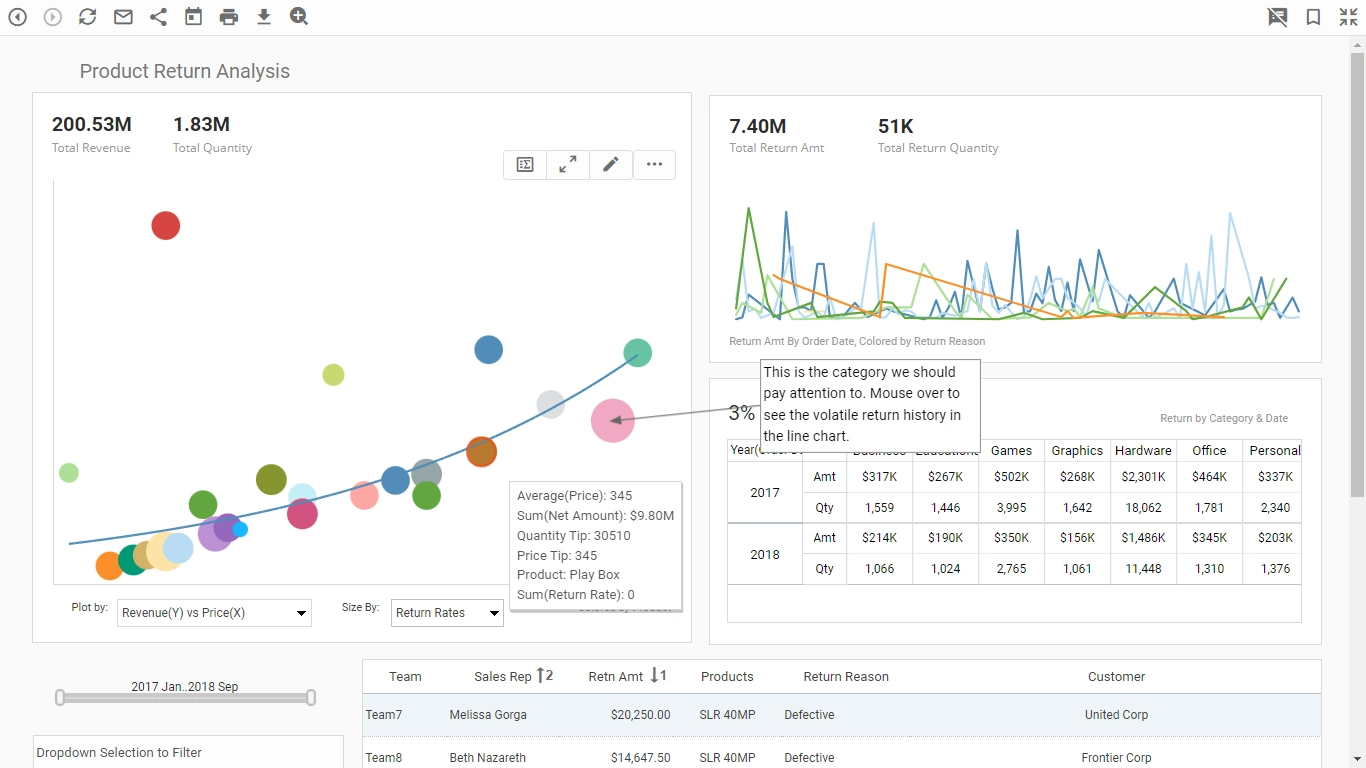
InetSoft’s reporting tools allows marketers to create web-based interactive reports that can take the viewer from a high-level view of marketing performance down into the details for further investigation. Advanced visualization allows for a further analysis and multidimensional exploration of data.
With instant connectivity to Google Analytics, Google Ads, salesforce.com, Survey Monkey, and a host of other marketing oriented data sources, InetSoft’s reporting tools makes it easy to measure KPI’s such as total cost per lead, incremental sales, website bounce rates, average lead scores, and more.

With a versatile and customizable reporting tools, analyzing the engagement of website visitors and potential leads has never been easier.

Benefits of a Marketing Reporting Application
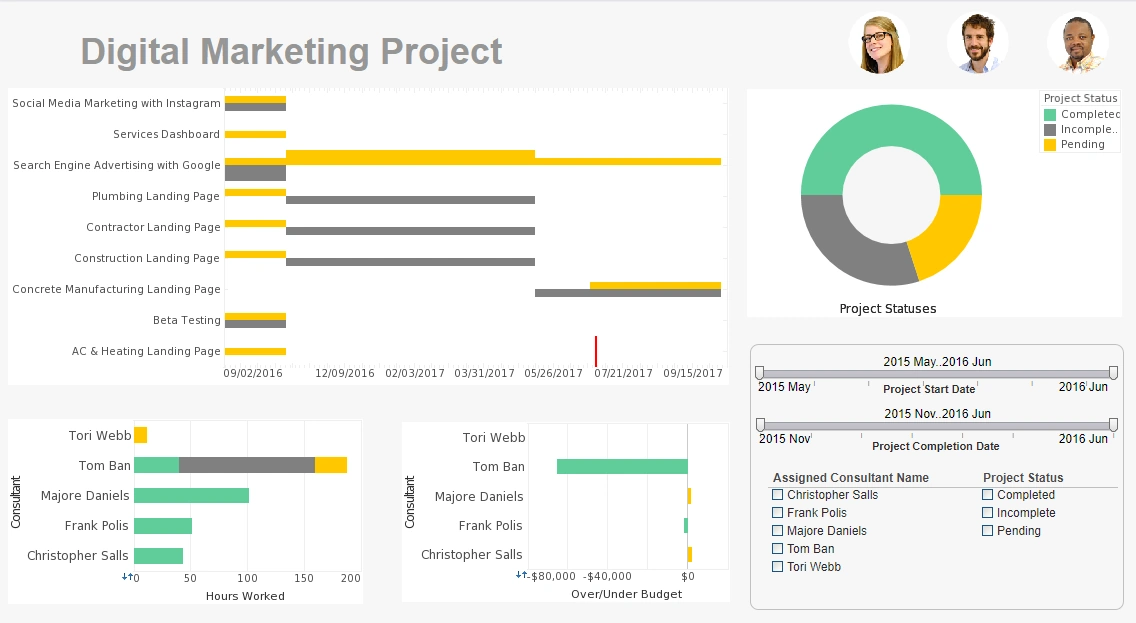
InetSoft’s marketing reporting tools are easy to use, customize, and adjust to the end user’s personal preferences. The application can be up and running in weeks, not months. The reporting tools make it easy for marketing professionals to analyze various data in reports, visualizing metrics such as engagement on social media, and the success or lack thereof of pay-per-click advertisements. With InetSoft’s drag-and-drop interface and point-and-click controls, marketing users who lack a technical background can build interactive marketing reports, all without help from IT.
In addition to this, InetSoft’s reporting tools provide the opportunity to mash up marketing data from a variety of sources to provide a unified view of corporate progress. Data mashup is useful for creating various marketing KPI’s, because it makes merging data from various data sources easy and effortless. Through mashup capability, users are able to drag and drop acquisition data from Google Analytics and mash it up with opportunity data from salesforce.com or any common CRM. Since InetSoft’s marketing reporting tools ensure web based accessibility, these mashup driven reports can be shared and distributed across the company, allowing all team members to be on the same page.
Other InetSoft Features
InetSoft’s marketing reporting tools have many capabilities which allow for further data exploration. Marketing KPI’s such as email marketing engagement scores, net promoter scores, or number and quality of backlinks can all be thoroughly investigated through filtering, highlighting, and brushing. These tools allow for the studying of a specific aspect of the marketing data on the report or dashboard.
InetSoft’s reporting tool is also mobile-friendly and works on any web-browser, making it more accessible and versatile. With all the reports viewable through the click of a button on a phone, users will never be out of touch with marketing progress again.
With InetSoft’s marketing reporting tools, marketing teams will constantly be up to date and can further advance corporate goals by studying and analyzing their reports. Not only is the marketing software easy to use and learn, it can quickly be up and running. Register now to see how you can attain the perfect software for your marketing needs.
What to Measure with Online Marketing Reporting?
Measure Your ROI
You should also keep tabs on your online marketing efforts by measuring your return on investment (ROI). This will help you determine whether your efforts are paying off and whether you need to make changes to your strategy.
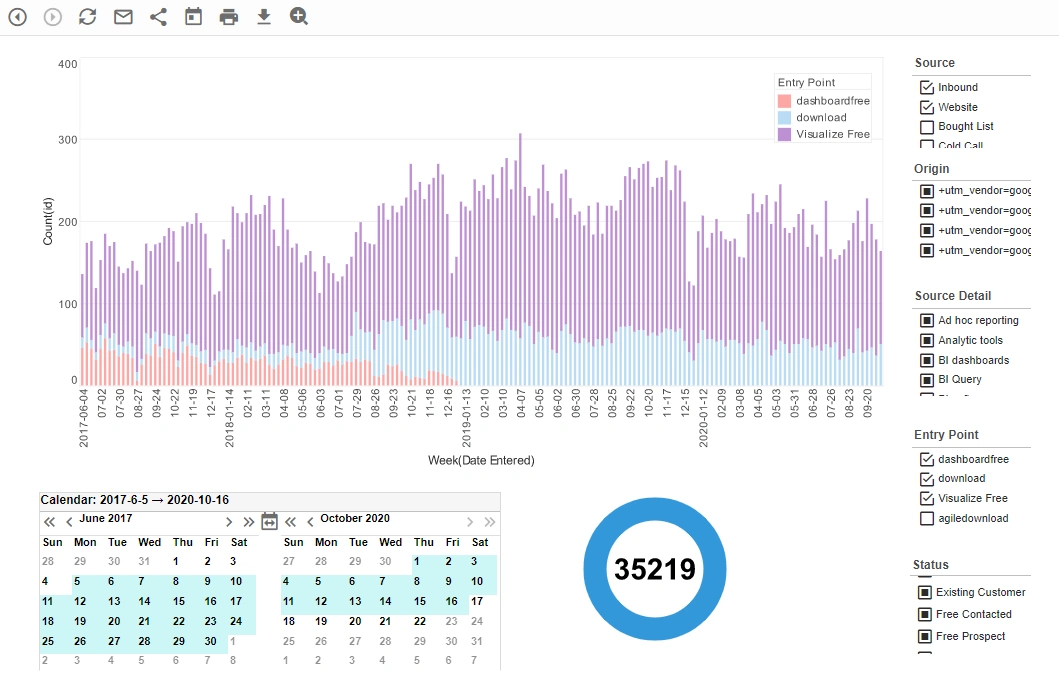
Monitor Your Website Traffic
One of the easiest ways to monitor your site's performance is to use Google Analytics. It allows you to track how people find your site, where they go once they arrive, and how often they come back. Monitor SEO performance by watching which are your top landing pages and comparing year-over-year organic traffic.
Analyze Your Social Media Performance
Social media platforms like Facebook and Twitter offer analytics tools that allow you to see how well your posts perform. You can also use these tools to analyze your competitors' performance.
Track Your Email Marketing Campaigns
If you're using email marketing software, you'll probably find a lot of features that help you track your campaign's progress. These features will show you how many people opened your emails, clicked through links, and converted into customers.
Measure Conversions
The best online marketing reporting tool should be able to help you measure conversions, analyze data, and provide insights into what works and what doesn't. You want to know if your ads are working, if your social media posts are driving traffic, and whether your email campaigns are converting.
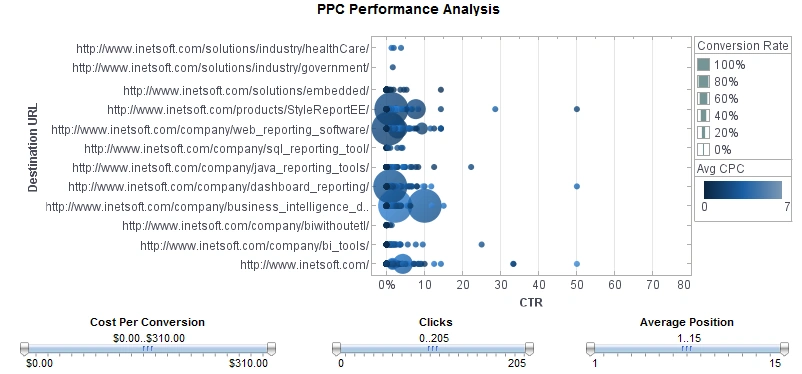
Key Metrics Tracked in Pay-Per-Click (PPC) Campaigns
Pay-Per-Click (PPC) campaigns are a cornerstone of digital marketing, allowing businesses to drive targeted traffic to their websites by paying for each click on their ads. To evaluate the success of PPC campaigns, marketers track a variety of metrics that provide insights into performance, cost-efficiency, and return on investment (ROI). Below are the key metrics commonly tracked in PPC campaigns.
1. Impressions
Impressions measure the number of times an ad is displayed, regardless of whether it is clicked. This metric indicates the reach and visibility of a campaign. High impressions with low clicks may suggest that the ad is not compelling or relevant to the audience.
2. Clicks
Clicks represent the number of times users interact with an ad by clicking on it. This metric is fundamental to PPC, as it directly relates to the cost incurred (since advertisers pay per click) and indicates initial user interest.
3. Click-Through Rate (CTR)
CTR is calculated as the percentage of impressions that result in a click (Clicks ÷ Impressions × 100). A high CTR suggests that the ad is relevant and engaging to the target audience. For example, a CTR of 2% means 2 out of every 100 impressions led to a click.
4. Cost Per Click (CPC)
CPC measures the average amount paid for each click on an ad (Total Cost ÷ Total Clicks). This metric helps marketers assess the cost-effectiveness of their campaigns. Lower CPCs are desirable, but they must be balanced with ad quality and conversion potential.
5. Total Cost
Total cost is the overall amount spent on a PPC campaign over a specific period. This includes all costs associated with clicks, regardless of the outcome. Monitoring total cost ensures campaigns stay within budget.
6. Conversions
Conversions track the number of times users complete a desired action after clicking an ad, such as making a purchase, filling out a form, or signing up for a newsletter. Conversion tracking requires proper setup, such as adding tracking pixels or tags to a website.
7. Conversion Rate
Conversion rate is the percentage of clicks that result in a conversion (Conversions ÷ Clicks × 100). A high conversion rate indicates that the ad and landing page are effectively driving users to take the desired action.
8. Cost Per Conversion (CPA)
Cost Per Conversion, or Cost Per Acquisition (CPA), measures the average cost of acquiring a conversion (Total Cost ÷ Conversions). This metric is critical for evaluating the ROI of a campaign. A lower CPA indicates a more cost-efficient campaign.
9. Quality Score
Quality Score is a metric used by platforms like Google Ads to assess the relevance and quality of an ad, its keywords, and the landing page. It is based on factors like CTR, ad relevance, and landing page experience. Higher Quality Scores can lead to lower CPCs and better ad placements.
10. Return on Ad Spend (ROAS)
ROAS measures the revenue generated for every dollar spent on a PPC campaign (Revenue ÷ Ad Spend). For example, a ROAS of 5:1 means $5 in revenue for every $1 spent. This metric is essential for assessing the financial success of a campaign.
11. Ad Position
Ad position indicates where an ad appears on a search engine results page (SERP) or display network. Higher positions (e.g., position 1 or 2) typically receive more visibility and clicks but may come at a higher CPC.
12. Impression Share
Impression share is the percentage of impressions an ad receives compared to the total number of impressions it could have received based on its targeting settings. Low impression share may indicate budget constraints or low ad rank due to poor Quality Scores.
13. Bounce Rate
Bounce rate measures the percentage of users who click an ad but leave the landing page without taking any further action. A high bounce rate may suggest that the landing page is not relevant or engaging enough for the audience.
14. Average Session Duration
Average session duration tracks how long users spend on a website after clicking an ad. Longer session durations can indicate higher engagement with the content, while shorter durations may point to issues with the landing page.