Monthly Dashboard Examples
As your business grows, so does your need for monthly dashboards that will automate business monitoring and management. Better sales numbers, more salespeople, more clients and accounts to manage also means more products to ship and track, more employee information to file, and more variables to react to.
That's why InetSoft designed the easy-to-use dashboard software, StyleBI. In addition to web-based interactive dashboards, StyleBI also contains a powerful reporting engine that readily meets the needs of companies of any size.
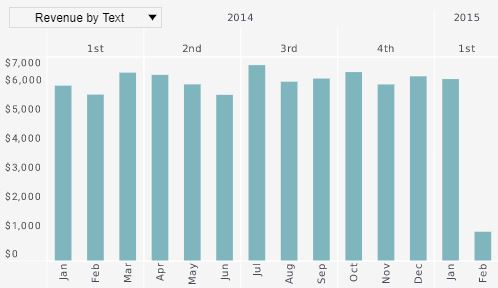
Track monthly revenue movement and segment performance in one visual.
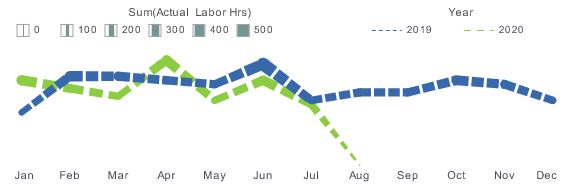
Monitor monthly labor utilization, costs, and productivity variances.
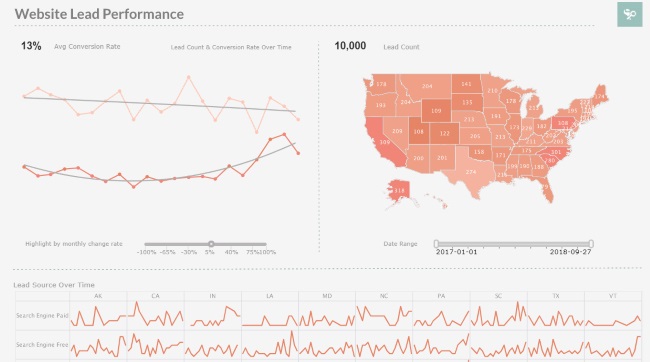
Compare monthly lead volume, conversion quality, and campaign contribution.
StyleBI is a responsive, effortless, dashboard report-making utility that allows you to start building informative monthly reports immediately. As a dashboard tool, StyleBI has one of the shortest learning curves in the industry, turning even a true beginner into an expert quickly. As you strive for greater success, it will remain easy to react to an ever-evolving business environment.
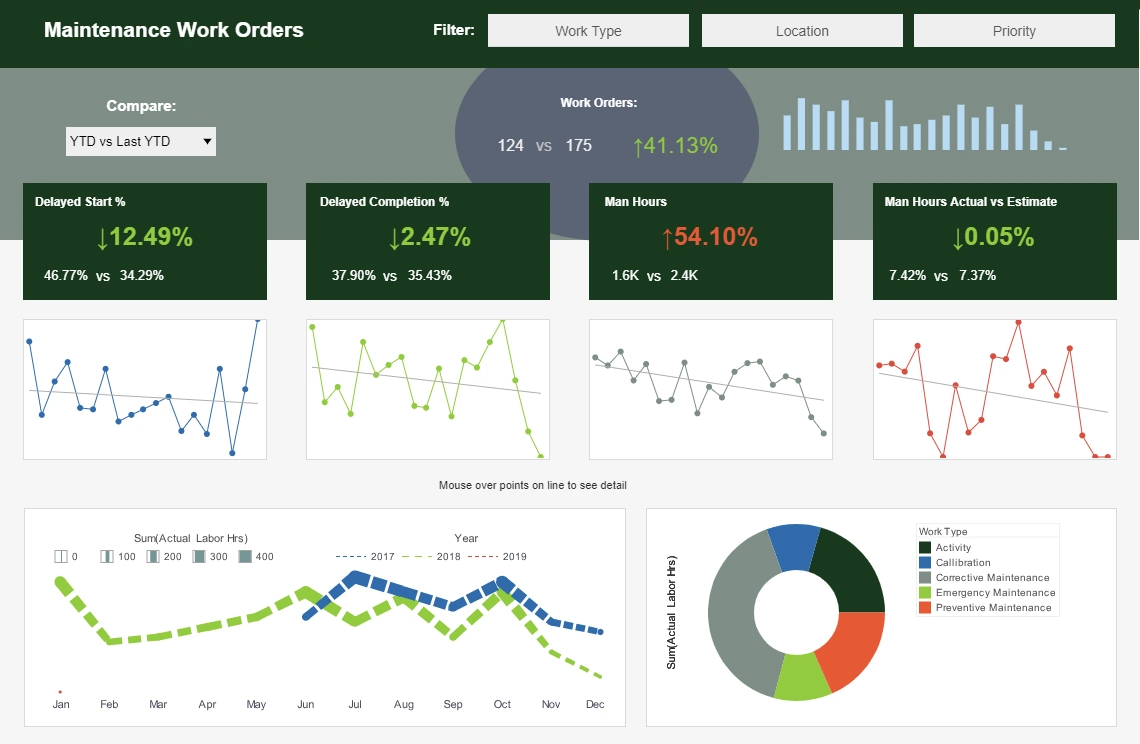
Schedule Monthly Dashboards and Reports
In addition to interactive dashboards which can be set to update on whatever basis is preferred, the user can take advantage of many report-making utilities such as the report navigation toolbar and the report scheduler. The navigation toolbar streamlines access to your data, allowing you to jump around a digital multi-page report quickly. The scheduler, in essence, delivers reports to you on its own. It can email, archive-for-later, print reports monthly, or even go beyond timed updates and deliver live information based on customized settings.
StyleBI alerts and schedulers benefit you the most on the go, as the dashboard software gives you access to reports and dashboards on your smartphone, letting your projects become portable.
The scheduler has hidden advantages that benefit users automatically, such as bursting. With bursting, the data from many reports is combined into one huge report for efficiency. The reporting engine then automatically delivers to each user only the sections of the report that are relevant to them. This spells the end of frustrating wait times and missed opportunities. With access to data needs virtually unimpeded, project managers and executives can not only benefit from automated monthly reports, they can also react to new information and make strong decisions on the fly.

More Monthly Dashboard Examples
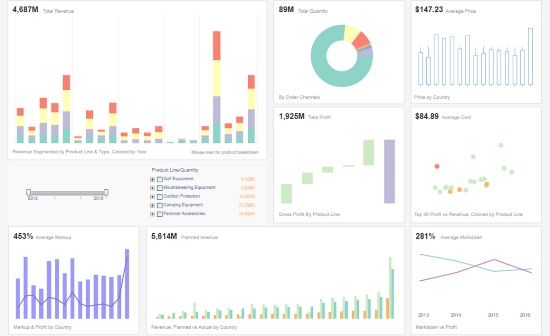
Review monthly sales by team, territory, and product with fast drill-down paths.
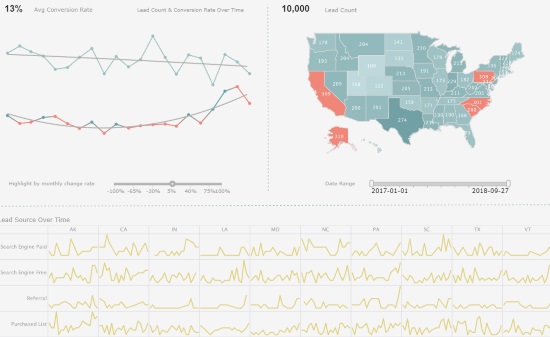
Follow monthly lead trends and channel performance to sharpen campaign planning.
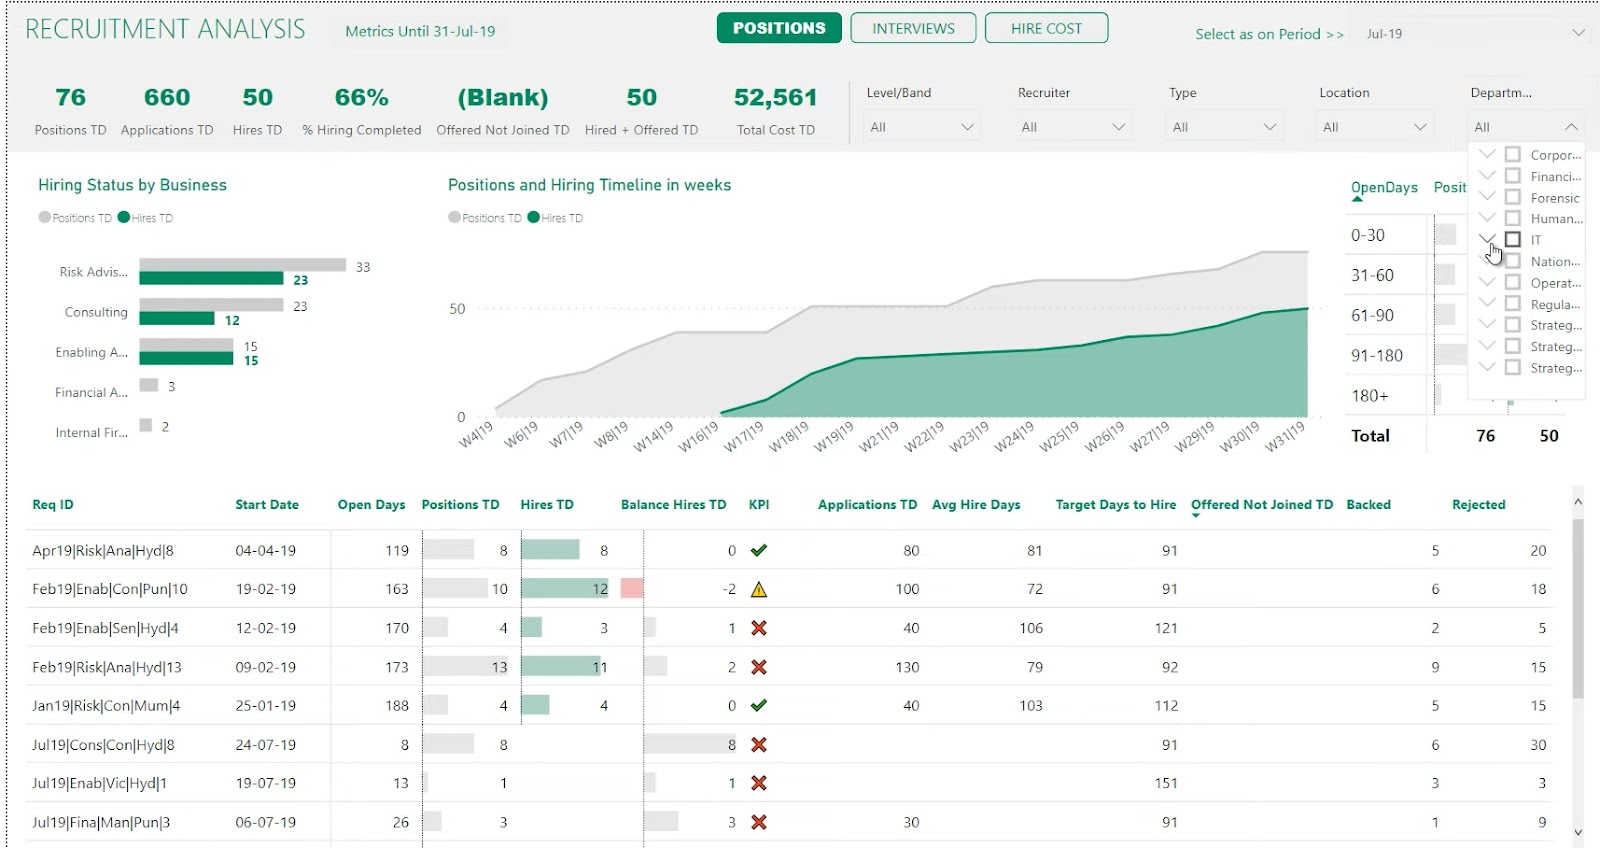
Analyze monthly hiring funnel speed, sourcing quality, and offer acceptance rates.
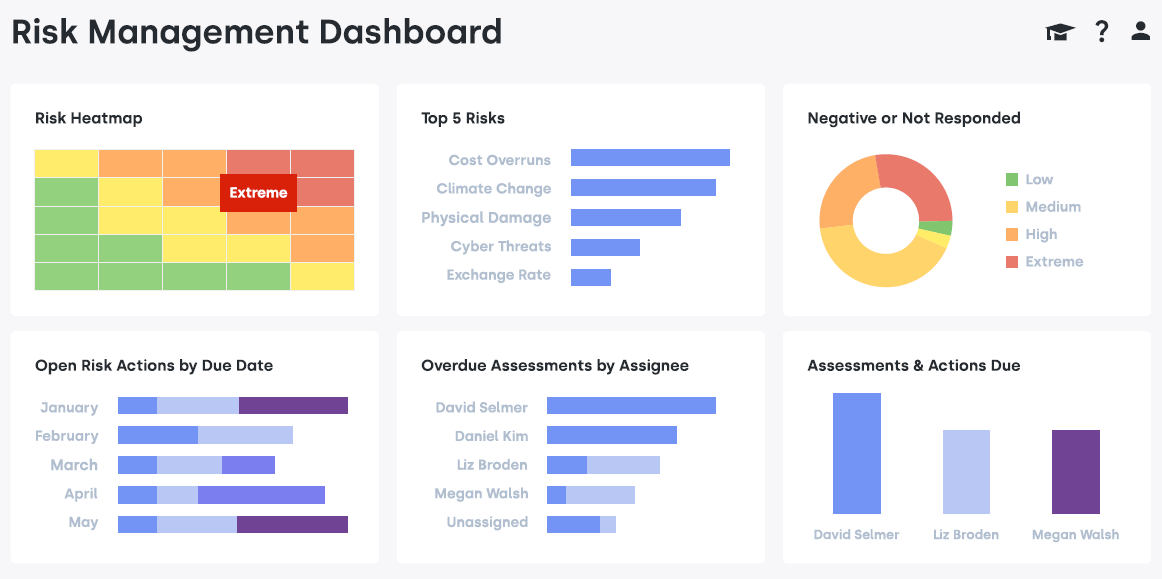
Spot monthly risk patterns early with KPI thresholds and trend snapshots.
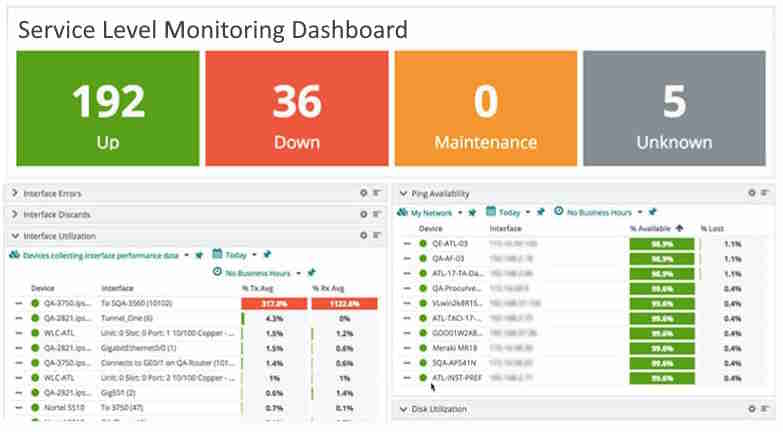
Measure monthly service-level targets, response times, and exception volume.
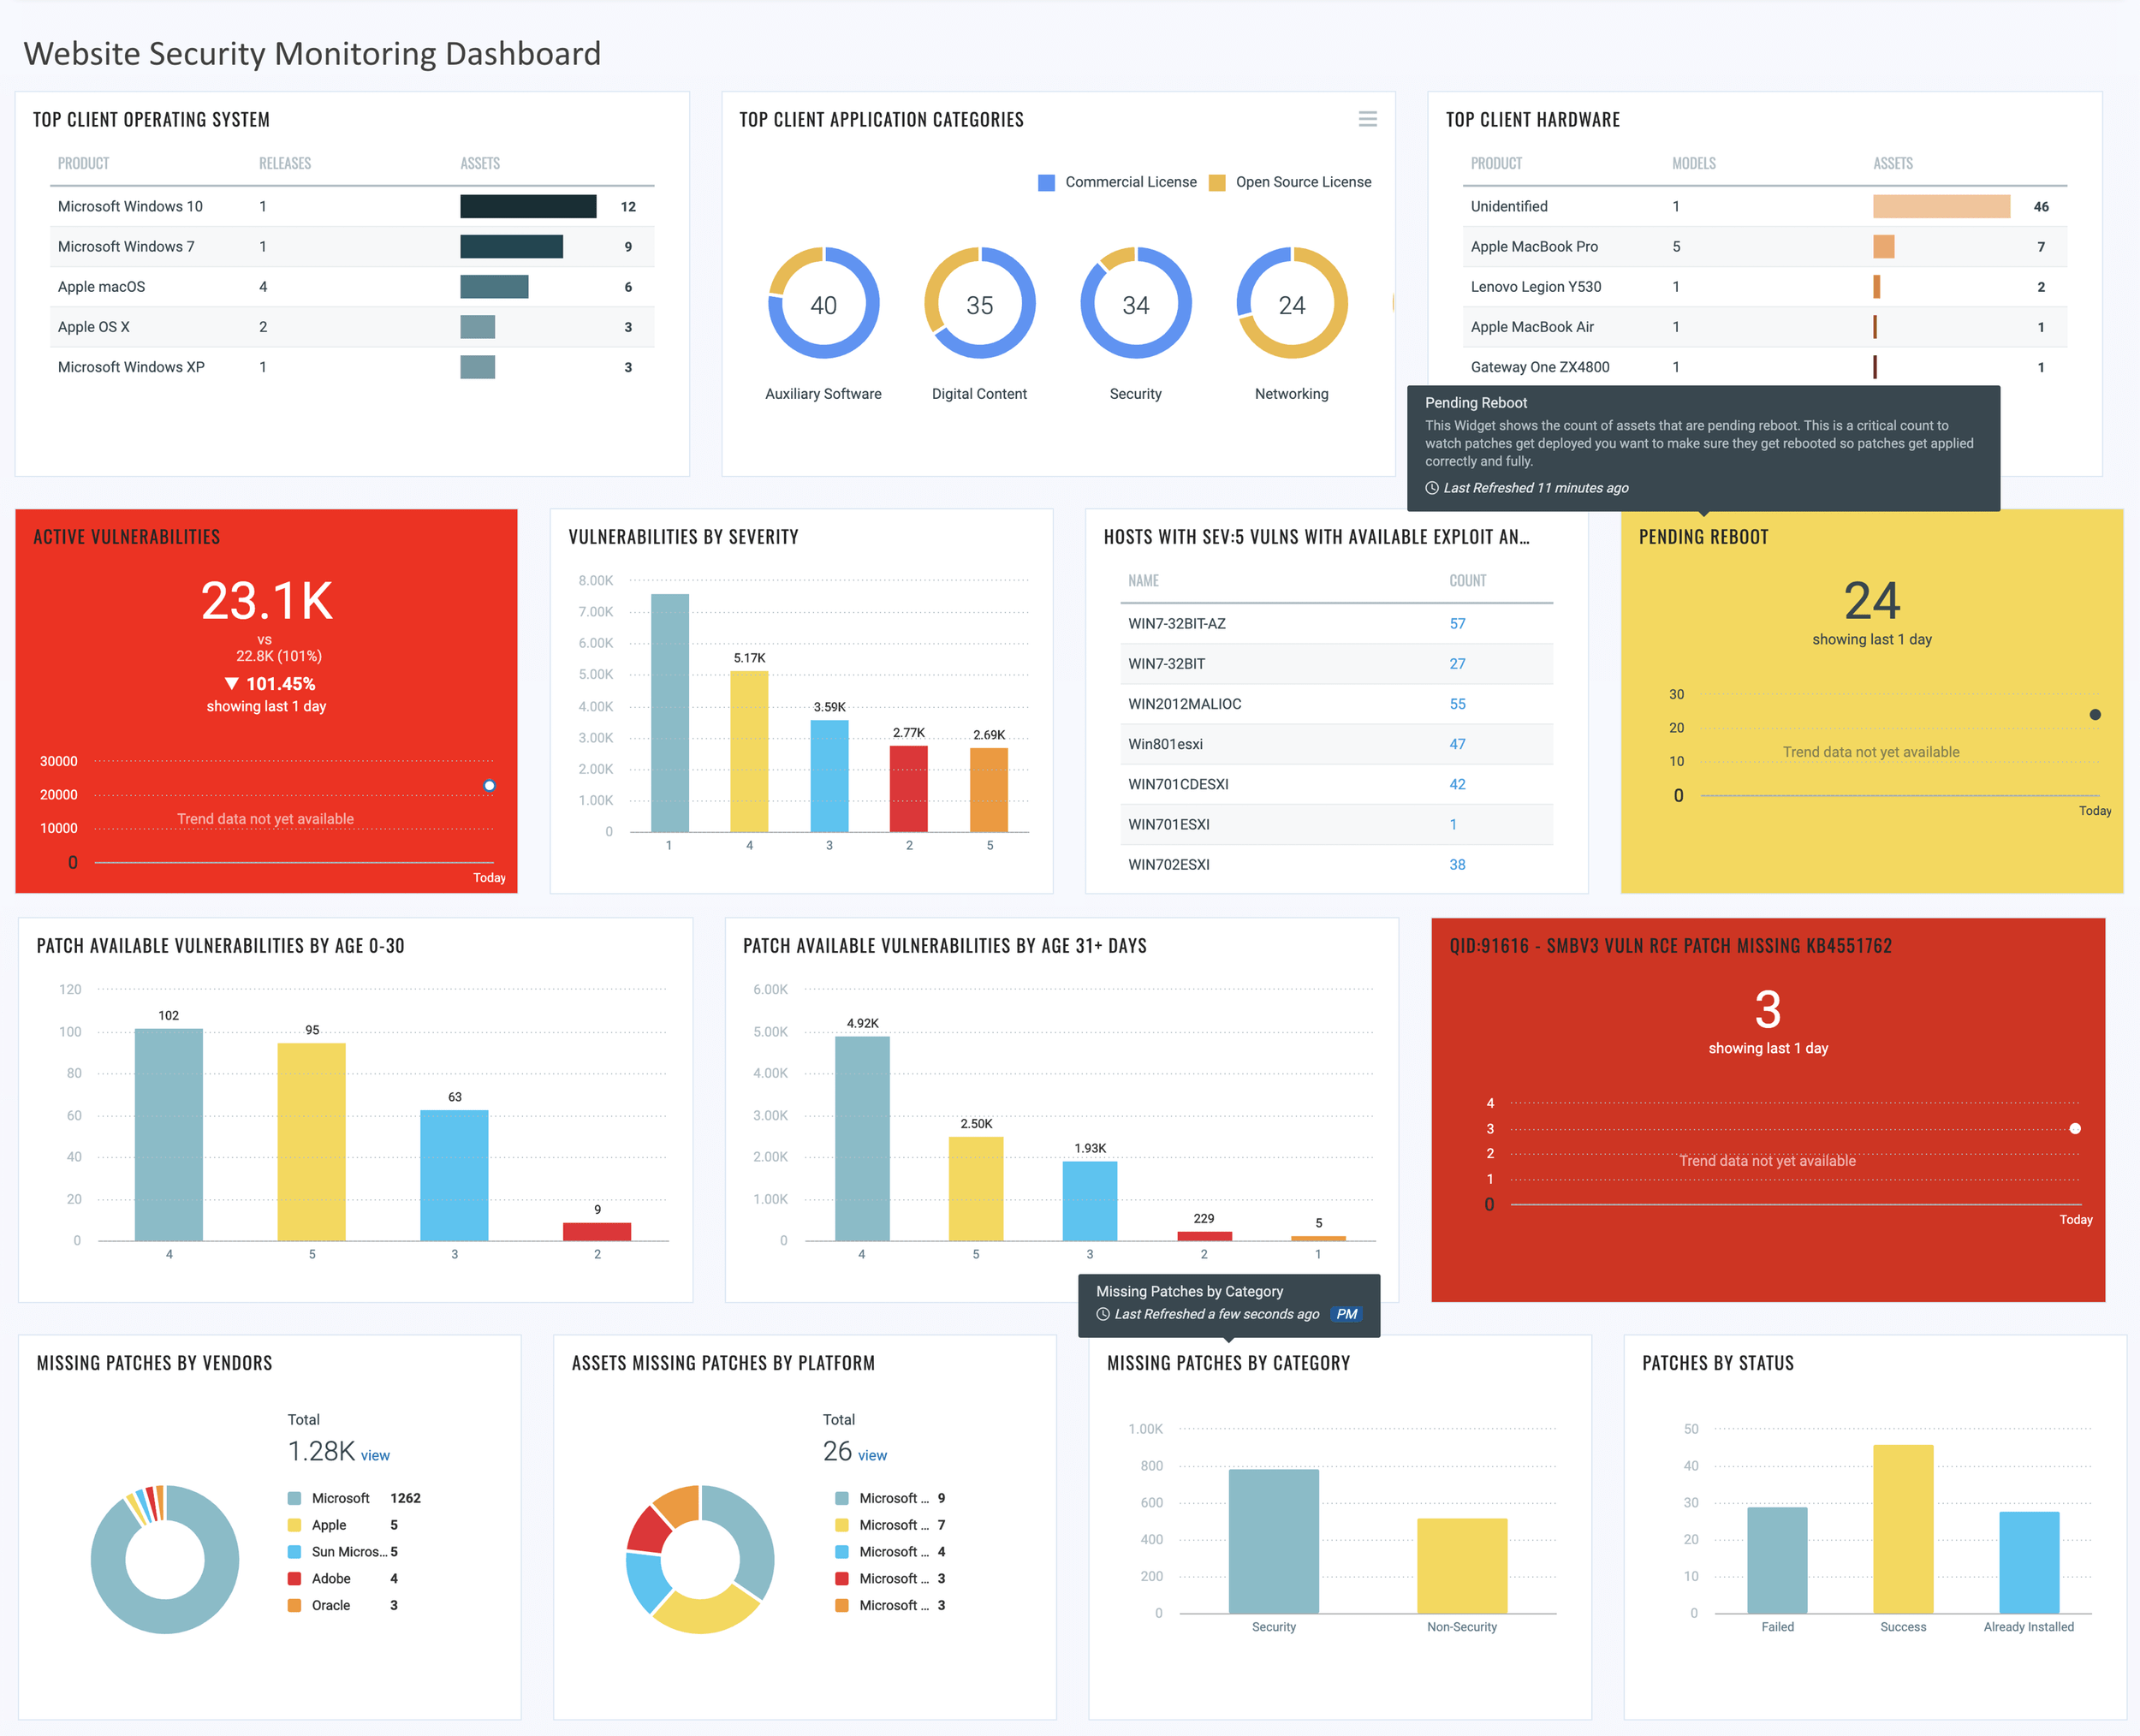
Track monthly security incidents, response health, and control effectiveness.
Industry KPI Articles
-
Real Success Of An Online Store
This article explains why e-commerce performance should be evaluated with a balanced KPI set instead of top-line revenue alone. It walks through conversion, acquisition efficiency, order economics, retention, and margin visibility in practical terms. The piece emphasizes how each metric supports better decision-making at a different point in the customer lifecycle. It also clarifies how comparing these measurements over time helps teams spot weak points early. The result is a stronger operating model for scaling online growth without sacrificing profitability.
-
Improve Efficiency Productivity And Morale
This HR-focused guide outlines the KPI framework operations analysts use to manage workforce health and cost. It covers attendance, turnover, employee satisfaction, and internal mobility as indicators of organizational stability. The content connects each metric to actionable interventions such as staffing policy updates and manager coaching. It also highlights the value of tracking trend lines rather than isolated monthly snapshots. Together, these insights help HR teams prioritize initiatives that improve outcomes for both employees and leadership.
-
Essential Healthcare KPIs And Data Visualizations
This healthcare article focuses on KPI-driven visibility across clinical, operational, and administrative functions. It explains how visual analytics can support demand planning, quality improvement, and patient-centered service delivery. The page also discusses predictive techniques that help institutions respond proactively to emerging pressure points. By combining multiple data sources, teams can gain a more complete view of throughput and outcomes. The overall message is that better KPI design leads to more resilient and responsive care operations.
-
Cash Flow Is Like Lifeblood
This finance article frames liquidity monitoring as a core business discipline rather than a periodic accounting exercise. It describes the metrics treasury and finance leaders use to understand immediate spending power and cash position. The content highlights forecast quality, inflow and outflow timing, and visibility across fragmented bank relationships. It also explains why real-time access to this information improves planning accuracy and risk control. As a result, organizations can make faster decisions while protecting short-term operational stability.
-
Drive Efficiency In Energy And Utilities
This piece explores how analytics supports operational resilience in the energy and utilities market. It addresses volatility, cost pressure, and the need to balance service reliability with sustainability goals. The article shows how KPI visibility can improve strategic planning and execution under changing conditions. It also emphasizes the importance of reliable, cohesive data for managing complex infrastructure environments. The takeaway is that strong measurement practices enable providers to adapt faster and perform with greater confidence.
-
Top Ways Analytics Are Used
This insurance-focused article reviews practical analytics use cases that improve speed and accuracy in core processes. It explains how KPI tracking strengthens risk classification, claims handling, and customer retention strategies. The content also shows how behavioral and policy data can improve segmentation and service targeting. Automation is presented as a key enabler for reducing cycle time and operating friction. Overall, the article positions KPI-based analytics as a competitive requirement in modern insurance operations.
-
Boost Your Hospitality Business With Data Analytics
This hospitality article explains how KPI-driven analytics can raise performance across occupancy, service, and marketing functions. It describes using historical patterns and contextual signals to support better pricing and demand planning. The page also discusses how guest behavior insights can guide personalization and experience design. Teams can use these metrics to refine campaigns and improve return on promotional spend. In practice, the approach helps hospitality operators convert data into repeatable service and revenue gains.
-
Digital Transformation Through Web Apps
This real estate article outlines how digital channels and business intelligence modernize property operations. It highlights KPI visibility for marketing reach, lead quality, and transaction pipeline movement. The content links better analytics to stronger customer experiences for both buyers and agents. It also explains how web-enabled workflows improve speed, consistency, and transparency across teams. The result is a more scalable model for competing in a data-driven property market.
-
Monitored And Analyzed For Peak Performance
This manufacturing article focuses on KPI tracking for production efficiency, quality, and throughput control. It explains how managers can use visual metrics to identify bottlenecks and prioritize corrective action. The page also describes how shared operational views improve coordination between plant and executive stakeholders. With better measurement discipline, teams can reduce waste while improving consistency. The central value is converting high-volume process data into daily decisions that protect margin and output.
-
Controlling And Understanding Logistics Data
This logistics article centers on KPI visibility for transportation performance and cost management. It discusses combining data from multiple systems to improve route analysis and service reliability. The content shows how interactive metrics help managers evaluate profitability across lanes and shipment types. It also points to flexible analysis features that make operational troubleshooting faster. Taken together, these capabilities support better planning and stronger logistics execution in competitive markets.
-
Cut Down On Number Of Key Performance Indicators
This law firm case-style article describes a KPI rationalization effort led by firm leadership. It shows how reducing clutter and focusing on a smaller metric set can improve governance quality. The narrative emphasizes alignment between management structure and performance review practices. It also demonstrates how prototyping and partner workshops can accelerate adoption of a clearer measurement model. The outcome is a more actionable KPI program that supports better strategic conversations.
-
Track Various Key Performance Indicators
This education article discusses KPI use in K-12 environments for monitoring student and operational outcomes. It highlights how schools can use analytics to support planning, intervention, and resource allocation decisions. The content also references newer technologies that expand data-informed teaching and administration. By organizing critical indicators in one place, leadership teams can identify priorities more quickly. The overall approach strengthens accountability while helping educators respond to changing needs.