Looking for a new dashboard software solution?
A business intelligence dashboard is a data visualization tool that helps managers make key decisions. BI Dashboards are typically single screen displays that show the current status of key performance indicators in an organization. As technology advances, new business intelligence applications are emerging. At the same time, these programs are becoming more complex, leaving managers and not-IT employees frustrated.
High maintenance fees, steep overhead costs, and mandatory employee training adds up very fast. InetSoft ensures a fully loaded solution for these challenges which companies are experiencing from other business intelligence software.
Try StyleBI
InetSoft's StyleBI software offers an easy-to-deploy, and even easier-to-use, BI platform at a lower cost. Designed with accessibility in mind, businesses can easily adopt this solution. StyleBI is easy, agile, and robust, enabling high-level reporting and dashboarding at all employee levels.
| #1 Ranking: Read how InetSoft was rated #1 for user adoption in G2's user survey-based index | Read More |


Features for Analysis and Visualization:
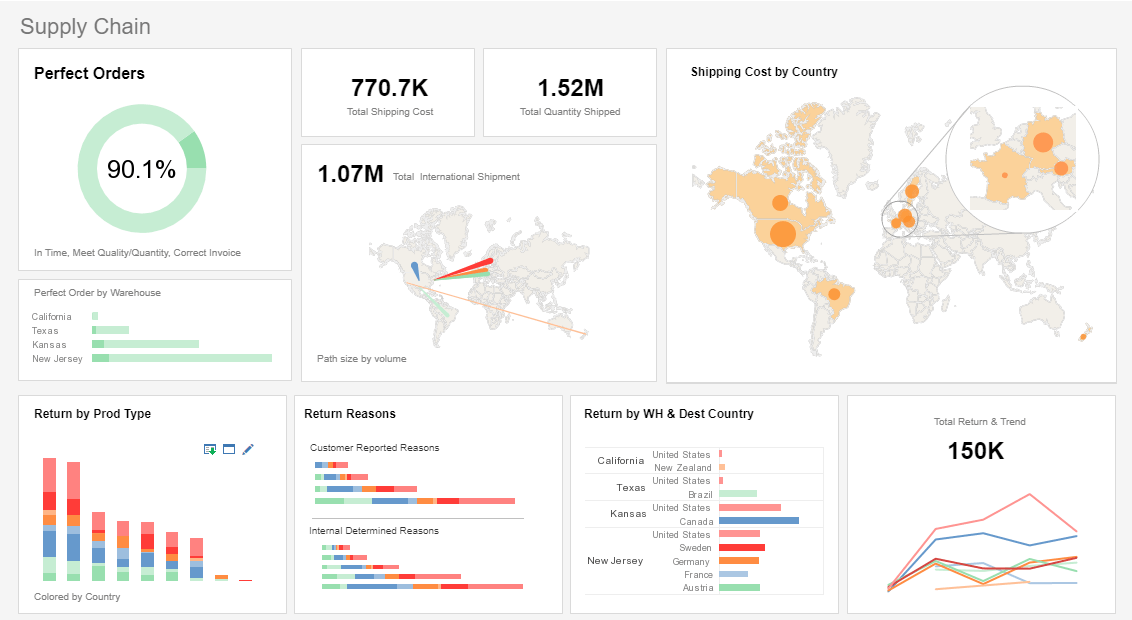
- Interactive Dashboards - view data by creating interactive objects (data selection drop-downs, tables, crosstabs, charts, maps, gauges, thermometers, sliders, calendars, etc.)
- Multi-dimensional Charting - use colors, shapes, and stacked x/y axes to add additional dimensions, displaying more information in a single chart
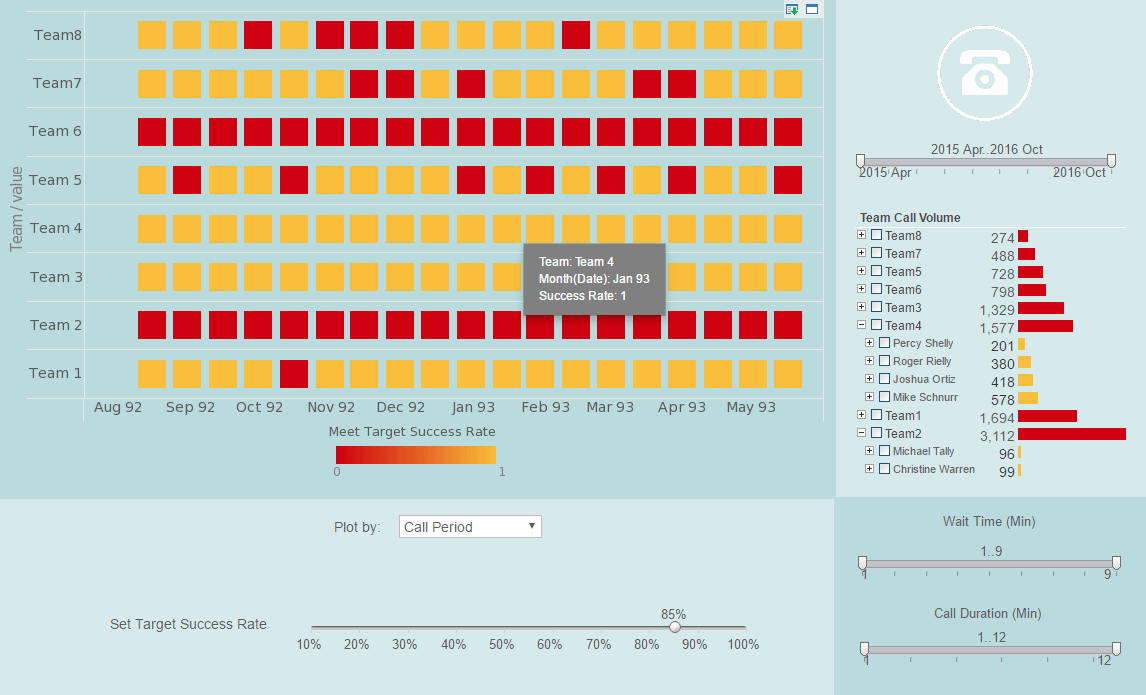
- Multi-charts - aka trellis graphs, visual crosstab, or small multiples; use to compare many series side by side to spot trends or outliers
- Maps - plot summarized data by geography, and interactively explore using zoom, and pan
- Expression Formula - add an expression or formula column using SQL or JavaScript syntax
- Highlighting - conditionally format important information using color or font properties
- Brushing - select data points in one chart to highlight related points in accompanying charts
- Named Groups - group categorical and numeric data into buckets or ranges
- What-If Analysis - experiment with scenarios by combining user input with dynamic data
- Visual Analysis - perform multi-dimensional visualization and analysis on OLAP cubes and non-cube data; use point-and-click interactivity to explore large amounts of data in a single analytical space
- Report Integration - drill down to reports or embed reports in dashboards
About InetSoft
Since 1996 InetSoft has been delivering easy, agile, and robust business intelligence software that makes it possible for organizations and solution providers of all sizes to deploy or embed full-featured business intelligence solutions. Application highlights include visually-compelling and interactive dashboards that ensure greater end-user adoption plus pixel-perfect report generation, scheduling, and bursting.
InetSoft's patent pending Data Block™ technology enables productive reuse of queries and a unique capability for end-user defined data mashup. This capability combined with efficient information access enabled by InetSoft's visual analysis technologies allows maximum self-service that benefits the average business user, the IT administrator, and the developer. InetSoft solutions have been deployed at over 5,000 organizations worldwide, including 25% of Fortune 500 companies, spanning all types of industries.


