InetSoft's Solution for Procurement Dashboards
When trying to monitor key performance measures for procurement, such as the percentage of non-contract purchases to total purchases, you need the right BI tools to properly value your future acquisitions.
A robust BI solution is one that can analyze and collate massive amounts of data, providing actionable insights for a competitive price. And in order for your organization to get the full benefit from your data, all departments need to be able to access and explore data relationships, enabling better business decision-making.
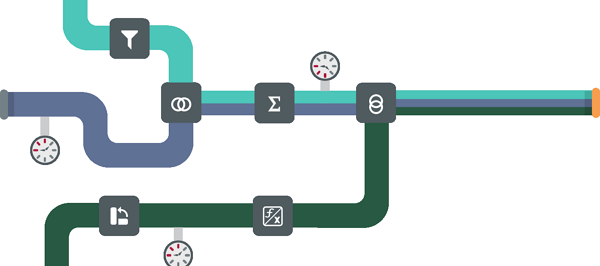
InetSoft's powerful and robust BI platform, StyleBI, pulls all necessary data from multiple sources for dashboards, visualizations, and automated reporting. InetSoft's robust data mashup engine is compatible with an almost unlimited number of different data sources, even internationally distributed ones.
Even large corporations, who may have multiple ERP and/or financial systems as a result of mergers and acquisitions, will be able to create a single source of organizational information.


Going Beyond Microsoft Excel
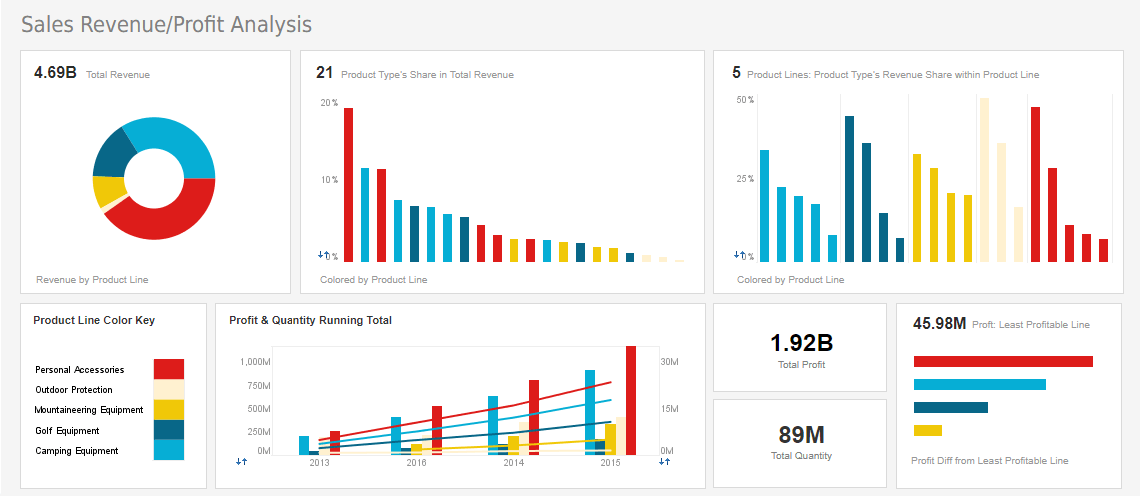
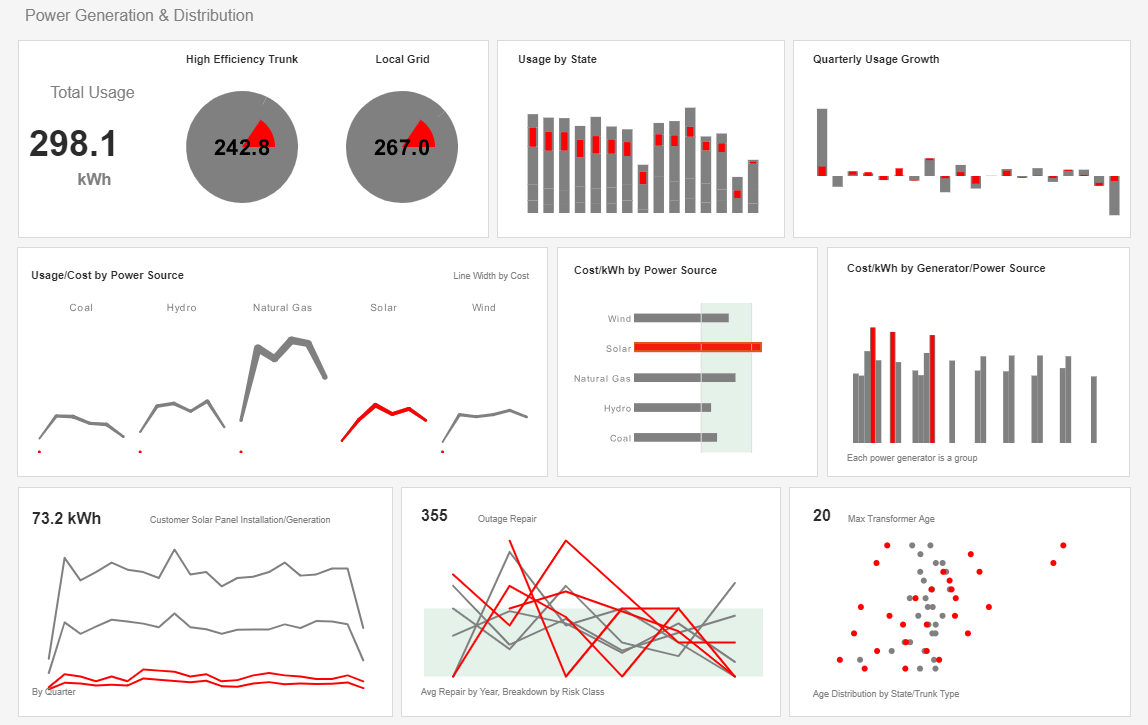
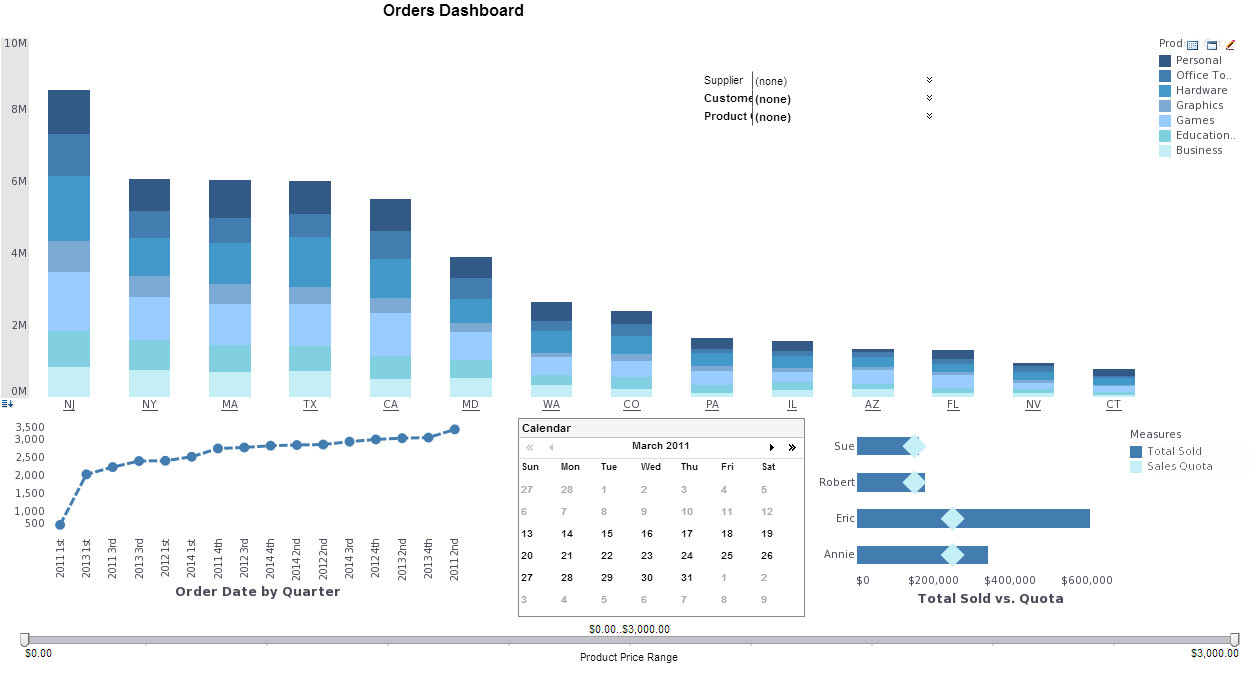
When data is amalgamated into one source of information, you then have the power to do large corporate finance benchmarking and DCF models, to value your next possible acquisition and their competitors. InetSoft's solution enables the creation of remarkable mashup-driven dashboards that display large numbers of metrics in a visual, intuitive way, for executive and managerial use. Since the platform is web-based, financial dashboards can be accessed through desktops, laptops, mobile phones, and tablets, giving your employees access to valuable insights wherever they go.
The use of Excel and PowerPoint alone can only get you so far in generating impactful, insight-producing views of your financial data. With InetSoft's drag and drop user viewsheet, Excel power users can quickly build any type of dashboard that they desire. Making procurement information easy to observe and analyze, InetSoft's ease-of-use will give your employees more time for other projects, increasing the overall efficiency of your organization.
What KPIs and Metrics Are Used on Procurment Dashboards?
Procurement dashboards have become essential tools for organizations that want to optimize purchasing, control costs, and manage supplier performance effectively. By consolidating a range of key performance indicators (KPIs) and metrics, procurement dashboards allow decision-makers to track efficiency, identify bottlenecks, and strategically guide sourcing efforts. In essence, these dashboards turn procurement from a reactive, transactional function into a proactive driver of business value. To understand their true importance, it is helpful to look at the most common KPIs and metrics used in procurement dashboards, what they mean, and what actions can influence them positively.
1. Cost Savings and Cost Avoidance
One of the most closely watched KPIs in procurement is cost savings. This measures the actual reduction in spend achieved through negotiations, bulk purchasing, supplier competition, or process improvements. Cost avoidance, on the other hand, tracks situations where potential costs were prevented, such as negotiating away a price increase or avoiding late penalties.
To affect cost savings, procurement teams can strengthen supplier negotiations, improve forecasting accuracy, and implement strategic sourcing practices. Cost avoidance can be enhanced by proactive contract management, risk analysis, and better alignment with internal demand planning. Together, these metrics demonstrate the direct financial value procurement adds to the organization.
2. Purchase Order Cycle Time
Cycle time measures how long it takes from the creation of a purchase order (PO) to the order’s fulfillment or delivery. Long cycle times often indicate inefficiency in approval workflows, supplier delays, or lack of automation. A shorter cycle time improves responsiveness and ensures that operations have the resources they need when they need them.
Organizations can reduce PO cycle time by automating procurement processes, streamlining approval hierarchies, and adopting electronic data interchange (EDI) with suppliers. Training internal stakeholders on timely requisition submission and standardizing procurement policies also lead to quicker turnaround.
3. Supplier Lead Time
Closely tied to cycle time, supplier lead time measures how long suppliers take to deliver after receiving an order. This is critical for inventory management and production planning. Longer or inconsistent lead times can cause stockouts, missed deadlines, and increased carrying costs.
To improve this metric, procurement professionals can negotiate service-level agreements (SLAs) with suppliers, diversify the supplier base to reduce dependence on a single source, and build closer partnerships with vendors to increase reliability. Monitoring supplier performance consistently also ensures that lead times remain predictable.
4. Supplier Performance and Compliance
Supplier performance KPIs track quality, timeliness, and compliance with contract terms. Metrics often include defect rates, on-time delivery percentages, and compliance with sustainability or ethical sourcing requirements. Poor supplier performance can increase costs, damage brand reputation, and disrupt production.
Organizations can affect these metrics by establishing clear supplier scorecards, conducting periodic reviews, and fostering collaborative relationships. Suppliers should be given transparent expectations, and those consistently underperforming may need corrective action plans or replacement. Investing in supplier development programs can also raise standards across the vendor base.
5. Procurement ROI
Procurement return on investment (ROI) measures the value procurement activities generate compared to the costs of running the procurement function. It highlights how effectively procurement contributes to the organization’s bottom line.
Improving procurement ROI often requires automation, analytics, and strategic sourcing. By reducing overhead costs and driving larger cost savings, procurement can increase its contribution to profitability. Additionally, adopting category management helps focus resources on the most impactful spending areas.
6. Spend Under Management
This metric refers to the percentage of total organizational spend actively managed by the procurement team. A higher percentage indicates stronger oversight and control over purchases, leading to better compliance, negotiation leverage, and cost savings. Conversely, unmanaged spend often results in higher costs and inefficiencies.
To increase spend under management, procurement must expand its influence across departments, implement spend analysis tools, and enforce policies requiring approved sourcing channels. Educating internal stakeholders on the benefits of procurement involvement is equally important.
7. Maverick Spending
Maverick spending measures purchases made outside of approved procurement processes or without preferred suppliers. Such spending typically increases costs, weakens supplier relationships, and complicates compliance tracking.
Reducing maverick spending requires enforcing procurement policies, offering user-friendly e-procurement systems, and promoting catalog-based buying with preferred vendors. Making approved processes easier and more efficient for end-users significantly decreases the temptation to go off-contract.
8. Supplier Concentration Risk
This KPI measures how dependent the organization is on a small number of suppliers. High supplier concentration increases vulnerability to disruptions if a supplier fails or becomes unreliable. Procurement dashboards highlight this risk so that organizations can plan diversification strategies.
Mitigating concentration risk involves developing alternative suppliers, conducting periodic risk assessments, and implementing dual-sourcing strategies. Geographic diversification also reduces exposure to regional disruptions such as political instability or natural disasters.
9. Contract Compliance and Utilization
This metric tracks whether suppliers and internal buyers are adhering to negotiated contract terms, including pricing, volume commitments, and service standards. Poor compliance erodes the value of negotiated agreements and increases procurement costs.
Improving compliance requires contract lifecycle management systems, regular audits, and collaboration with suppliers to ensure alignment. Internally, organizations must communicate the benefits of compliance, provide visibility into available contracts, and make contract-based purchasing easier.
10. Procurement Cycle Cost
Procurement cycle cost refers to the total administrative and operational cost of processing a purchase order, from requisition to payment. High cycle costs often point to manual processes, redundancies, and inefficiencies. Reducing this cost improves the overall efficiency of the procurement function.
Automation is the most powerful lever to affect procurement cycle cost. Implementing procure-to-pay (P2P) systems, robotic process automation (RPA), and standard operating procedures reduces manual workload and lowers expenses. Continuous process improvement methodologies like Lean and Six Sigma can also uncover hidden inefficiencies.
11. Supplier Diversity
Many organizations track the percentage of spend allocated to diverse suppliers, including minority-owned, women-owned, or small businesses. This metric is increasingly important for social responsibility, compliance with government requirements, and brand reputation.
To positively influence supplier diversity, procurement can actively seek and qualify diverse vendors, include them in bidding processes, and set targets for diverse spend. Building mentoring programs to support these suppliers can also strengthen long-term partnerships.
12. Inventory Turnover and Stock Availability
Procurement is often evaluated on its role in maintaining the right balance of inventory. Metrics such as inventory turnover rate and stock availability highlight how well procurement aligns supply with demand. Too much stock ties up capital, while too little stock disrupts operations.
Improving these metrics requires demand forecasting, just-in-time (JIT) strategies, and closer collaboration with both operations and suppliers. Leveraging real-time data from procurement dashboards allows for dynamic adjustments to purchasing strategies.
13. Supplier Innovation Contribution
A more strategic KPI is measuring how suppliers contribute to innovation, whether through new product ideas, process improvements, or sustainability initiatives. Procurement is not only about cost—it can also be a driver of innovation when suppliers are engaged effectively.
Organizations can foster supplier innovation by encouraging collaborative product development, sharing market insights, and rewarding vendors that propose value-adding ideas. Strong partnerships that go beyond transactional relationships are essential to improving this metric.
14. Risk and Compliance Indicators
Procurement dashboards often track risk metrics such as supplier financial stability, geopolitical risks, regulatory compliance, and ethical sourcing adherence. These KPIs protect organizations from disruptions, legal penalties, and reputational damage.
To improve performance, procurement teams must conduct regular risk assessments, use third-party risk monitoring tools, and ensure suppliers comply with codes of conduct. Contingency planning, such as identifying backup suppliers, also reduces exposure to risks.


