Searching for Software for Performance Metrics?
Performance metrics software is a business management tool which allows a business to keep track of all aspects of their daily activity.
Software for performance metrics should allow businesses to
- Monitor critical business processes and activities using metrics of business performance which trigger alerts when potential problems arise and when goals are met.
- Analyze the root cause of problems by exploring relevant and timely information from multiple perspectives and at various levels of detail.
- Manage people and processes to improve decisions, optimize performance and steer the organization in the right direction.
With InetSoft's easy to use drag and drop dashboard design, your non technical users are able to fully customize performance metrics geared toward your specific business.
You have full control over with metrics and key performance indicators that you wish to choose and are able to combine and transform them with no coding required.


InetSoft's Key Metrics Software
Also known as a key performance indicator, or KPIs, a key metric is a statistic which, by its value gives a measure of an organization's or department's overall health and performance. All organizations, from nonprofits to multinational corporations, need to track key metrics in order to have an accurate picture of what is going on. Simply looking at key metrics can give a reading of an organization that would otherwise require sophisticated analysis of large amounts of data.
Every kind of organization has specific key metrics that it uses to track performance. Education organizations track dropout rates, attendance, and the student/teacher ratio. Emergency service companies measure metrics like response time, percentage of false alarms, etc. In addition to industry-specific key metrics, individual departments within an organization track metrics specific to their managerial goals.
A marketing department tracks key metrics such as conversion rates, value, and customer profitability. Supply chain managers often track inventory turnover, average order lead time, and out-of-stock performance. Metrics tracked by HR often include average training time, employee turnover, and average training cost per employee.
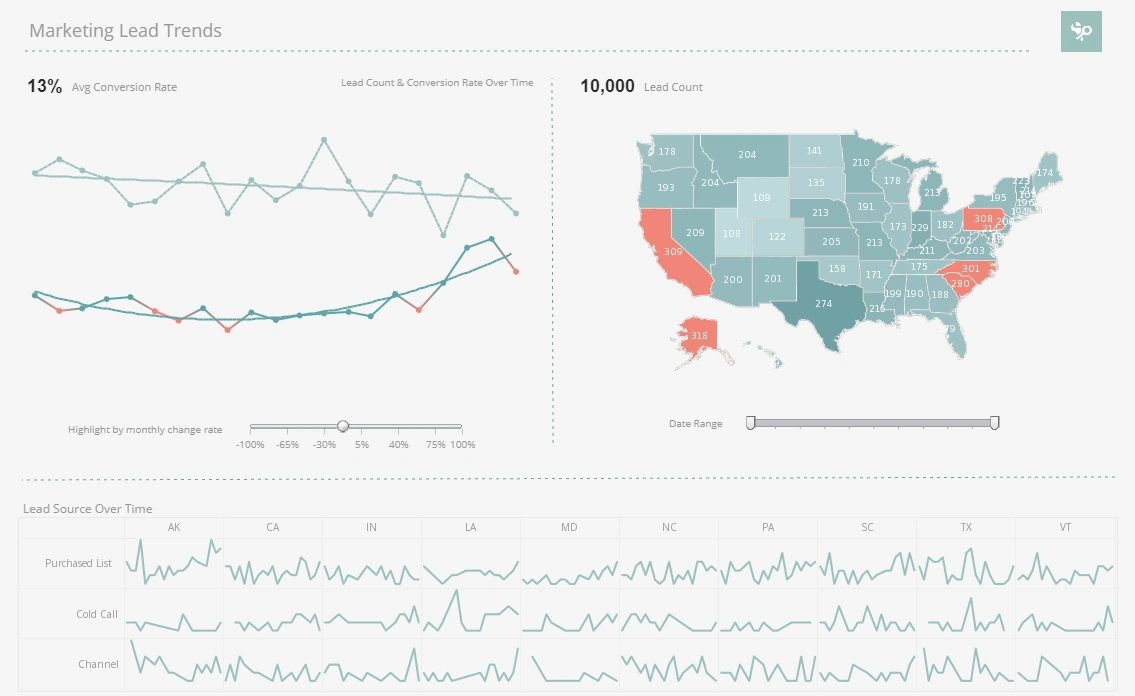
Key Marketing Metrics
Take the depth and breadth of information assimilated through your marketing campaigns and harness the intuitive agility of InetSoft's robust software available to you as a campaign dashboard, it's a no-brainer!
Over the years, InetSoft has continued to meet the demands of the BI field to bring the best and latest software service tools to the market with on-demand, flexible and embedded features, it makes InetSoft a one-stop-shop for all your marketing needs.
Marketing metrics that can be tracked with InetSoft's software are churn, conversion rates, customer value, customer profitability, CPL, CPA, and CPGA.
Common sales KPMs that are tracked are time to close, win rates, average deal size, sales actuals vs forecast, and quota attainment percentage.
Going beyond rudimentary marketing practices, Inetsoft adds to the value of key marketing metrics in executive dashboards with illustrative outliers, identifying other in-depth analytics, and bridging the gap between departmental KPI's. Besides being the basis of organizational developmemt, marketing metrics are what takes a company to the next level, provided that they are able to make real-time comparisons to benchmarks in their industry, and quickly pivot.
Most companies pride themselves on their data analysis because of the power it has to tap into a market. InetSoft's software takes the hard work out of this process and delivers a more agile, easy and robust software, that promises no better way, time or place to put these tools into practice.

What Metrics Are Used for Measuring the Performance of Software?
Measuring the performance of software is not just about how fast it runs; it’s about how effectively, reliably, and efficiently it serves its intended purpose. Organizations use a wide range of metrics to evaluate whether software meets user expectations, business goals, and technical requirements. These metrics typically span categories such as speed, scalability, resource usage, reliability, and user experience. Below are the key performance metrics commonly tracked.
1. Response Time
This measures how long it takes the system to react to a given request. For example, how quickly a web application loads a page after a user clicks. Low response time is critical for user satisfaction and directly influences perceptions of quality. Slow response times often lead to user frustration and abandonment.
2. Throughput
Throughput is the number of requests or transactions a system can process within a specific period. It reflects the system’s capacity to handle workload. For instance, an e-commerce platform might measure how many purchase transactions it can successfully process per second under load.
3. Resource Utilization
This covers CPU usage, memory consumption, disk I/O, and network bandwidth. Efficient software makes optimal use of hardware without creating bottlenecks. Monitoring these metrics helps identify inefficiencies or potential performance issues when scaling.
4. Scalability
Scalability metrics assess how well the software maintains performance when user load or data volume increases. Horizontal scaling (adding servers) and vertical scaling (upgrading resources) are both evaluated, with metrics showing whether the system can grow without significant degradation.
5. Availability and Uptime
Availability measures how often the system is accessible and operational. A system with 99.9% uptime still experiences almost 9 hours of downtime annually, which may or may not be acceptable depending on the application. This metric is crucial for mission-critical systems like banking, healthcare, or government applications.
6. Error Rate
Error rate quantifies the percentage of failed requests, crashes, or incorrect outputs compared to total requests. High error rates may point to code defects, system overload, or poor integration with dependencies. It’s a key metric for system reliability and stability.
7. Latency
Latency measures the time taken for data to travel from the source to the destination within the system. It’s especially important in distributed architectures and cloud applications, where network delays can significantly affect user experience.
8. Load Time
For applications with user interfaces, load time—how quickly a screen, dashboard, or feature becomes usable—is a key user experience metric. This is particularly critical in consumer-facing applications, where even fractions of a second can impact engagement and retention.
9. Maintainability
While not always considered a direct “performance” metric, maintainability affects long-term performance. Metrics here include code complexity, defect density, and mean time to repair (MTTR). Easier-to-maintain software tends to perform more consistently over time.
10. User Satisfaction
Finally, user experience metrics such as Net Promoter Score (NPS), customer satisfaction (CSAT), or task completion rate provide insight into how performance impacts actual users. Even technically high-performing systems may fail if users find them unintuitive or frustrating.