InetSoft Webinar Highlights: Text KPI Reporting Software and More
This is part three of a transcript of a webinar hosted by InetSoft demonstrating the new features of its 2023 release. The speaker is Katie Roussey, an InetSoft systems engineer.
Part Two can be found here
There have been quite a few customers that leverage scheduling. You can leverage just manually exporting as a user when consuming a dashboard, and in some cases, you might actually use the concept of a tabbed UI.
And you might have some additional detailed tables that you include in your dashboard, but you're not always visually showing, yet you would want to include when exporting, in particular when taking advantage of the options that Excel might support.
So we've enhanced the Excel export, and this would apply again also for scheduling Excel exports, not just manually exporting here, but you can have it export all of your tabbed tables in here into separate Excel workbook tabs.

So it's going to go into your one file. Also, when you've been doing your exporting, you've always had to select a specific version of the dashboard. Am I looking at my current view? Am I just having it export a particular bookmark's perspective of this dashboard? You will now have the option to actually select more than one bookmark and have it be included within this Excel export, as well as additional workbook tabs. So it's going to give a lot of flexibility. Watch your size, you don't want to have your Excel export becoming too large, but it's going to provide greater flexibility to not necessarily have to have as many separate exports that you can fit all in one file, which is really nice.
One little note about the bookmarks; as mentioned, there are going to be quite a few features mentioned today that we're not necessarily demoing. For one, we've added some administrative controls around bookmarks. You can use enterprise manager for managing your bookmarks, for viewing the bookmarks that exist in your assets.
Also, if you have auditing enabled you can see how many assets have bookmarks, how many bookmarks there are, when they were created, who created them, these will all also be captured in audit report as well. So this way you can get a view of your environment and make some changes and adjustments to enhance the health of your InetSoft deployment.
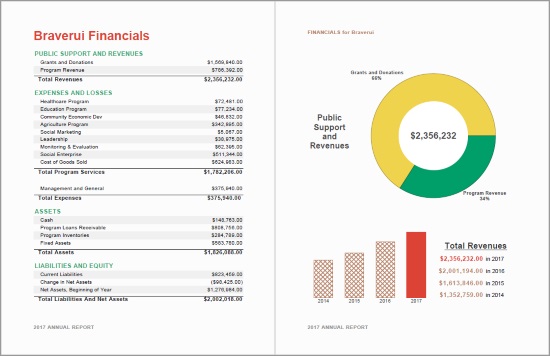
Text KPIs in Reports
Ad hoc reporting has gotten a nice little feature added to it. You've always been able to, with the ad hoc reporting, work with the charts and the tables and the crosstabs and had static text so you can have your nice titles and your labels, but we did not support having the text components bound to data. So that is something that has been added. So when you have a new text component, you do a right-click properties on it. And instead of in the general tab changing the static text content, you would jump to the new data tab. Just like with all components when you're working with ad hoc reporting, you can select your data model or your query or the output of your worksheet mashup. And you can then set the appropriate aggregation that you want to have in place and it will then be reflected in that text component.
Of course, you still have the flexibility to stylize the text components, set the alignments, set where it is within your ad hoc report, but it's wgoing to give you a little bit more flexibility and bring a little bit more of some of the features supported from Style Studio's perspective where you did that advanced report design as a full developer in that desktop tool. You can now do this text component binding to data that you always could do in Style Studio. It's a really great little feature.
Before we highlight the next big feature, I just wanted to touch on a few things that are going to be worth mentioning. There are enhancements within data model auto-drilling, the user portals, and virtual private models. We brought a feature in that was always supported in Style Studio. There have been some enhancements to some of our default script function library and options for creation parameters for scheduled tasks that you really should review. All of the feature lists are on the release notes, so when you're looking to do the upgrades you can really get a feel for all the features that are available.
Iframe Charts
A big thing for this next feature is that it actually was not fully flushed out in the release candidate. You will need to wait until the GA is posted within the next couple of weeks to fully use this feature.
This feature is a lightweight embedding of a chart from within a dashboard. So instead of embedding the entire dashboard, whether it was an entire dashboard that just included only a chart component, you would always still load in the iframe the entire infrastructure to support running a full dashboard, whether all certain visual components were needed or not.
So now this is a lightweight embedding specifically where you call a chart from within a specific dashboard and it will only load the necessary components to support that chart so the embedding is more lightweight. And it allows you to have the flexibility of multiple framed references. In this case, I have four separate charts from four separate dashboards and I'm able to have them on this flexible page and potentially have other content around this page and it will reduce the overall load of the loading of these charts within this page.
So when you're looking to do lightweight embedding to create a complement to your full dashboard integration within your websites and web applications, you can also have key charts from those dashboards picked and embedded in a more of a lightweight manner in certain aspects of your UI or your web pages that you want to showcase. So it's a really nice feature. The key thing is that it's only for chart components, so it's not for gauges or for like cross tabs. It's only for charts. And the great thing is that you can have a full dashboard that you want to pick a chart from. It does not have to be that you're explicitly designing separate independent charts. You really can just display charts from your existing dashboard.