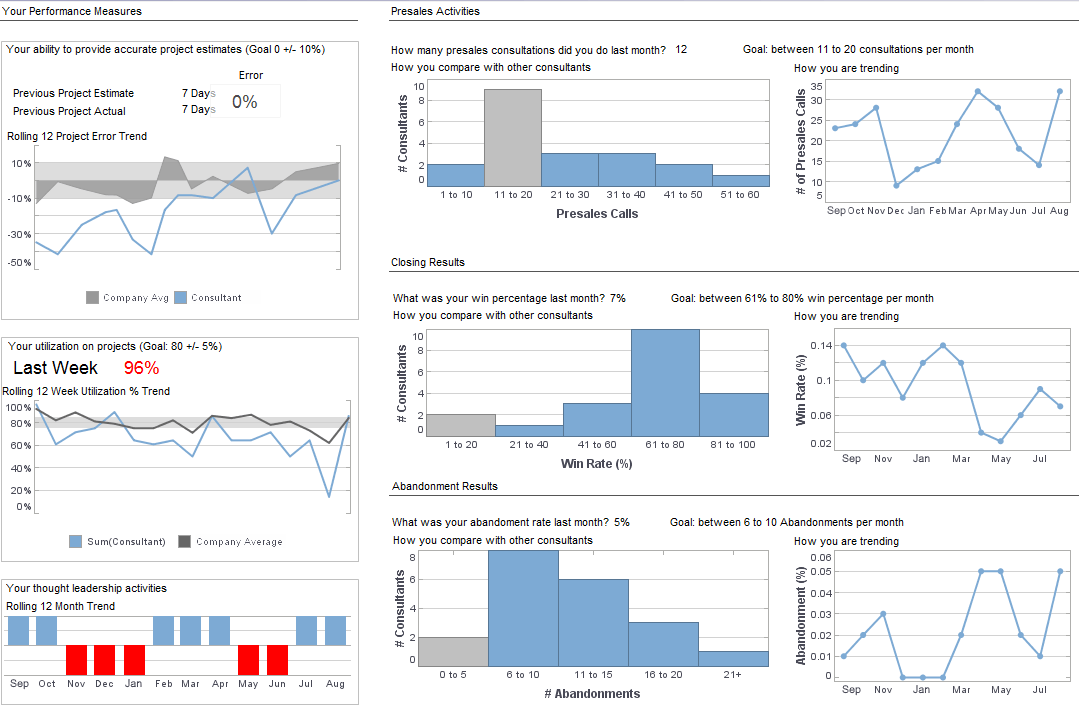
InetSoft Product Information: Analysis Dashboard Visualization
One of the best ways for you to gain an understanding of your data is to explore and experiment. Visualization is the key to doing this, and Style Intelligence provides a powerful visualization solution through easy-to-use dashboards called “Viewsheets”.
Viewsheet technology enables you to answer known questions and discover new questions to ask. To understand the kinds of problems that viewsheets can solve, we listed some of the common ones below:
• “I need to view selective portions of my data, without resubmitting a set of parameters over and over again to generate new reports.”
• “I need to analyze my data, but I have knowledge of the business, and not of how the data is stored.”
• “I need to perform interactive ‘What If’ analysis on my data, i.e., change inputs to test a hypothetical scenario.”
• “I need to analyze data obtained from different sources in real-time, e.g., data from an Excel spreadsheet and an Oracle database.”
• “I need to analyze live operational data as well as historical data.”
| #1 Ranking: Read how InetSoft was rated #1 for user adoption in G2's user survey-based index | Read More |
Opening an Analytical Dashboard
This article focuses on how to use viewsheets effectively, and demonstrates key concepts using sample viewsheets. To open a viewsheet, follow these steps:
1. Launch the Report Portal.
2. Click the Report tab at the top of the Report Portal.
3. In the tree on the left side of the Portal, expand a folder (e.g. ‘Tutorial’).
4. Single click an entry (e.g. ‘Analysis’).
You can experiment with the viewsheet by manipulating the various controls and observing how the display updates. To return a viewsheet to its original configuration, use the ‘Home’ button on the toolbar. To save a particular viewsheet configuration (control settings), use the ‘Add Bookmark’ button.
Dashboard Toolbar
The dashboard has a unique toolbar with the following function buttons:
The ‘Home’ button resets all dashboard controls to their original settings. This reverts the dashboard to the configuration in which it was first opened.
The ‘Previous’ button undoes the most recent action.
The ‘Next’ button restores the most recent action that was undone.
The ‘Edit’ button opens the current dashboard in the Visual Composer. For more information about creating and modifying dashboards using the Visual Composer refer to the Viewsheet Guide.
The ‘Refresh’ button updates the dashboard with current data.
The ‘Add Bookmark’ button saves the current control settings as a“bookmark.” When you open the bookmark in the future, the saved control settings are applied to the current data. (Unlike a snapshot, the bookmark is not stored in the Repository.)
Use ‘Browse Bookmark’, to restore a previous state that you bookmarked. Fresh data will be pulled from the database, but your prior settings will be applied.
The ‘Email’ button permits you to send an export of the dashboard to another person.
The ‘Save Snapshot’ button saves the current control settings as a“snapshot” in the Repository Tree. When you open the snapshot in the future, the saved control settings are applied to the current data. It is similar to a bookmark but creates a new repository entry and can be shared with others.
The ‘Export’ button allows you to export a copy of the dashboard in Excel, PowerPoint, or PDF format.
 |
Learn about the top 10 features of embedded business intelligence. |
|
Next: Data Binding in a Report
|

