BI Case Study: A Global Capital Markets Bank
A multi-national global bank headquartered in Australia engaged InetSoft for a bank-wide business intelligence initiative to address challenges experienced in their global expansion.
Organization Background
The bank is a global organization with businesses spanning investment banking, institutional trading & sales, corporate financing, asset management and retail banking. The business operates in all continents with major commerce centers in Asia, Europe and North America. Business is conducted around the clock globally. Books and operations are passed among major commerce centers with overlapping time zones. Relationships among business groups are multifaceted and dynamic.
Even with such a linked business model, each locale of operation requires flexibility so that their local market demands can be met in a timely fashion without causing global impacts. Due to the span of their operations, business groups are required to comply with different laws and regulations. For regulatory, legal, business or technical reasons, certain aspects of the business must be segregated and secured.


IT Operations Background
IT operations supporting business groups are dispersed in multiple continents' technical centers. They are responsible for ensuring the architecture and data integrity of all business systems. Security, compliance and compatibility are also important priorities. Many corporate-wide data and computer resources are owned and operated by IT. Business groups must share data and resources for bank wide consistency. With a mixed development model, both in-house IT units and vendor engineering teams are working closely.
After development and implementation, the goal is to hand over finished systems smoothly to in-house IT operations. For business group-owned information technology projects, business groups typically take ownership of the business requirements and processes. IT groups will ensure the project's integrity and compatibility. If no in-house development resource is provided, vendors are expected to work with analysts from business groups with only back-end support provided by IT
Owner Business Group Background
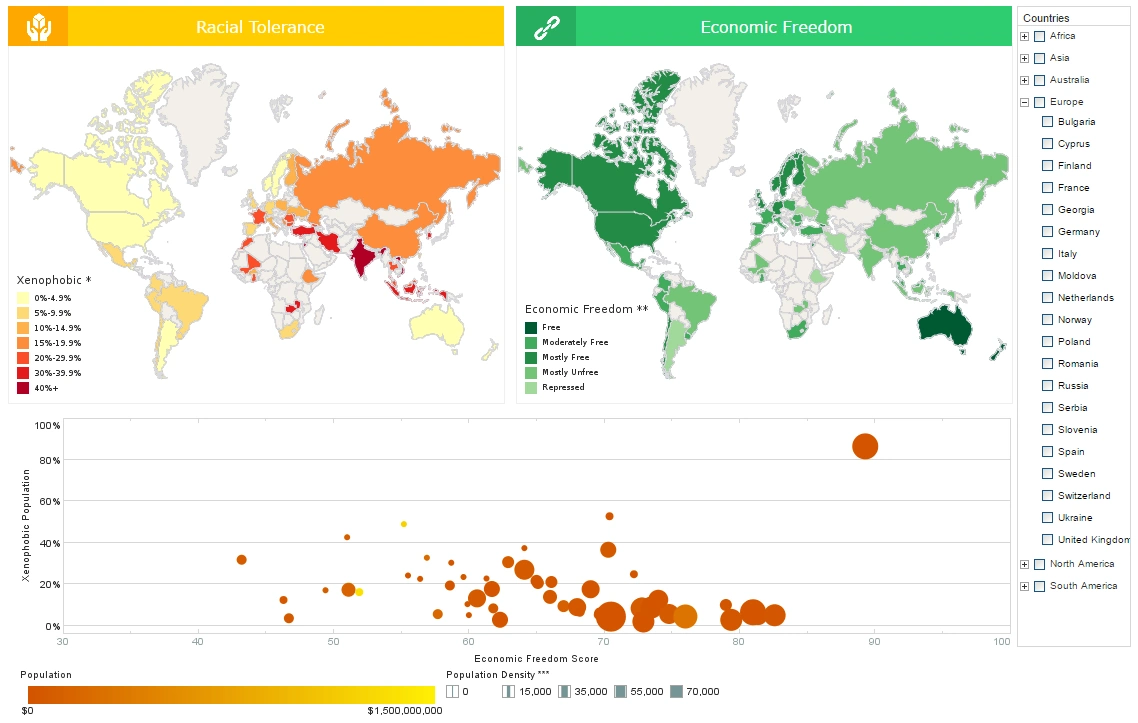
The project owner is a fast growing trading facilitation group in the bank. The main business focus of the group is to provide trading services and financing for institutional clients. The financial products traded are derivatives which consist of complex parameters. Hundreds of clients are scattered throughout the world and trade around the clock.
The group itself has corresponding local operations in major commerce centers to facilitate the business. In this fast paced business, the trading environment can quickly change direction. Both bank and client employees need an accurate understanding of their positions. Furthermore, historical analysis of past trading activities, with the ability to drilldown into the individual trade level, is important.
Business Challenges
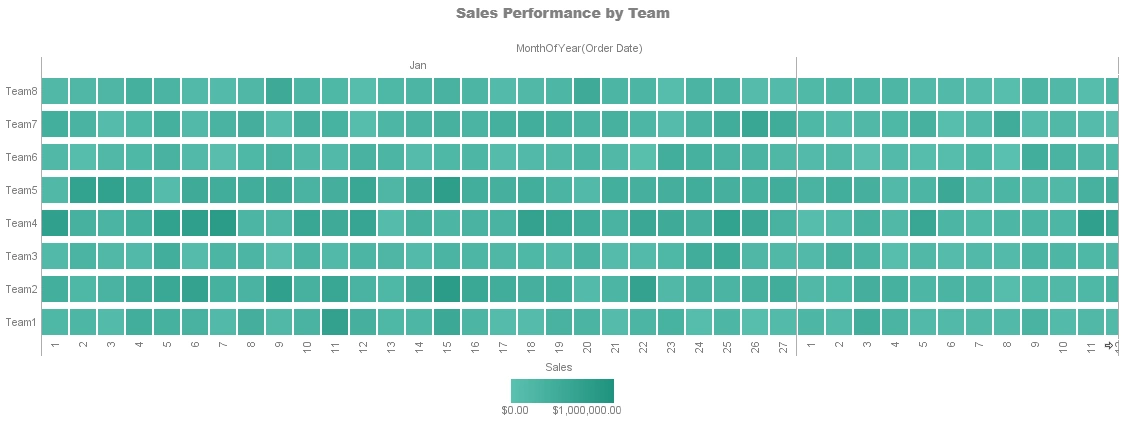
The bank employees and clients have been generating reports from the transactional system that records all trades. The system has multiple pain points. First, the conflict of serving transaction needs and business intelligence needs is causing system overload that many times delays trading execution. This can be costly to clients and the bank. Second, the system is designed for transactions. Therefore reporting is very slow. This is not only a pain but causes lost business opportunities. Third, inflexible reports can't be easily customized by users who many times resort to manually produced reports. Manual reporting is not matching trading demands but also is error prone. The fast growing client base really pushed current process to the limits.
Considered Architecture
The first considered solution was to build a data warehouse with associated ETL. After consulting with groups using data warehouses in the bank, it was clear that this solution would have serious shortcomings. Data warehouses are static modeled. This means it has a pre-defined data structured according to current known business needs. Constant reporting requests under current system has clearly demonstrated that needs can't be so well defined statically. This clearly doesn't fit derivative trading which is a quick moving target.
The second issue is the delay introduced by ETL and a data warehouse. Certain reports must be real time to reflect up-to-the-second positions. The challenge is to find a front end tool that can mix reporting against a transactional database and a data warehouse. Also, a data warehouse is normally self-contained which makes data linkage with bank wide data and systems even more challenging.
InetSoft's Architecture
After evaluating these challenges, InetSoft proposed an architecture that dynamically creates a data hub in the place of data warehouse. This data hub is incrementally populated. Instead of a predefined static schema, its creation is driven by visual reports and dashboards. Basically, it is a dynamic data warehouse. The ETL process is baked into the visual design process which produces visual reports as well as reusable data blocks.
Visual reports can be iteratively designed against the transactional database's schema. When it is deployed into production, the system materializes the underlying data queries into analytic-oriented, high performance data blocks residing inside the data hub. These data blocks remove the reporting load of querying the transactional database. The data blocks also deliver high performance because they are optimized for these reports. For real time reports, InetSoft's software can simply materialize, or cache the results of, the underlying queries and retain the live connection to the transactional database.
Other Key Features
Beside architecture considerations, the bank valued the following unique built-in features:
Multi-tenancy
Each client is set up as a tenant and requires total isolation. On the other hand, bank account managers need to able to see across his/her own accounts. Higher level management needs access across different group or all accounts.
Paginated Reports
Visual reports and dashboards are great for interactive use. But they do not replace the need for paginated reports which are suited for client statements and executive summaries.
Cascading Parameters & Wizards
For casual users, these functions are proven to be the easiest entrance points for self-service.
Pure-browser Visualization Design
Power users are from all different client organizations. It is impossible to install and manage desktop design tools in this situation. Only a 100% browser based tool makes power user self-service possible.
Data Hub/Data Blocks
he fact that the visual report design process creates data blocks that are not tied to the single report is very useful. The data hub only contains data blocks proven useful by its first associated report. Data blocks can all be reused and mashed up for other reports which makes it possible for less experienced users to do sophisticated self-service reporting.
Fault Tolerance & Scalability
Unlimited scalability is possible through Apache Spark based Big Data clusters with inherent fault tolerance built-in.
Built-in Auditing
An auditing database and associated reports for usage, load and other analysis helps greatly to maintain a clean and lean system.
Implementation Process
The customer decided to utilize InetSoft's service team to work with business analysts directly. This was a close relationship where our engineers collaborated with business analysts online sharing the same environment. Project planning, management and implementation was jointly administrated. The project went through the following stages:
Status Survey
Understanding transactional database schema and mapping existing reports to the data. Besides gathering knowledge, many existing reports were identified as suspect of being one-use leftover reports.
Gap Analysis
Identifying business need gaps that are not served by current systems. The main focus in this project was to review the reporting request history. It yielded a self-service tool gap and issues related to the lack of data reusability.
Bottleneck Verification
This process helped us discover that shared transactional databases are not the only culprit. Transcontinental data latency also played a significant role that needed to be addressed besides data processing.
Consolidation Proposal
Identifying opportunities to consolidate existing reports and new requirements to reduce needed reports. For the existing static reporting system, many clusters of 5-10 reports could be consolidated into one interactive dashboard.
Architecture Adjustment
Armed with new discovery, InetSoft proposed the best way to adjust the structure. In this case, the client was offered options for public cloud based or on-premises deployment as well as the selection of location for the server.
Incremental Migration
The most in-demand reports identified in previous stages were first addressed to test the architecture with real world data for performance.
Full Implementation
Multiple InetSoft engineers were engaged. This includes designers, test engineers, and system engineers.
Performance Tuning and Monitoring
After implementation, InetSoft's engineering team kept monitoring the system looking for bottleneck and hotspots.
Training and Transitioning
At this stage, InetSoft trained the bank's IT staff to manage the system. Further training was provided to the trainer on how to teach self-service for various users in a train-the-trainer model.
Please note this is not a linear process, it took many quick iterations among the various stages.
The Results
This solution allowed the bank to increase their client base quickly without concern over system limits. Provisioning the service and enhance the system has now become a simple task. Clients not only gained vastly improved performance but also gained self-service ability. Once the system was fully deployed within 6 months, the group only needed one part time administrator/designer. The InetSoft solution and services reduced the number of IT staffing and business resources.