Features and Benefits of a BI Solution
InetSoft offers a BI solution for dashboards, visual analysis, and reporting that is easy, agile, and robust. InetSoft's primary product, Style Intelligence™, offers a faster rampup, higher adoption rates, more flexible licensing options, and a greater deployment success rate than older, more complex BI solutions.
Key Features
- Support both transactional database and data warehouse
- Desktop quality zero-client browser based user interface
- Complete desktop application integration through Excel, PowerPoint, PDF, and Word
- Wizard based dashboard and report designer, minimal training required
- Ad Hoc reporting for maximum self-service
- Incorporates advanced dashboard, scheduling and notification
- 100% open standards platform for drop-in deployment
- Built-in report localization and integration
Key Benefits
- Utilize existing data directly, realize immediate return on investment
- Gradually introduce more self-service without disruptions
- Share information among operational users, power users, and executives
- Personalized information delivery and access

Enterprise Reporting and Business Intelligence
Style Intelligence is an open standards based information delivery and analysis solution that blends the best of enterprise reporting and business intelligence software into one light weight platform. It offers both large and small companies the ability to deliver actionable and real-time information while leveraging their existing technology and infrastructure investments.
By embedding Style Intelligence directly into business processes, organizations can dramatically decrease report design, delivery and support overhead to increase overall information technology return on investment.
How is Style Intelligence Used?
Production Reports
Operational reports are produced in electronic format and paper printouts for a wide range of users. Some reports, such as invoices and contracts, are generated from embedded reporting while others are produced from centralized reporting.
Interactive Reports
Interactive reports allow end users to control report output within pre-defined and controlled boundaries. Parameters, drilldowns and sorting are a few examples. Interactive reports provide the most basic analysis of data.
Ad Hoc Reports
Ad hoc reporting gives end users the ability to create and modify reports that introduce new data items and new presentation formatting. The Ad Hoc user interface is easy to learn and accessible from any Web browser.
OLAP Analysis
OLAP provides multi-dimensional data analysis for management personnel and analysts. It uses a set of hierarchic parameters to view a set of measurements. For example, sales date and sales location hierarchies can be used to view sales total and discount in different combinations and levels.
Alerting and Notification
Many reports are used for monitoring business processes. This can become an expensive process that consumes precious management time and resources. Alerts can be created to automate this process.
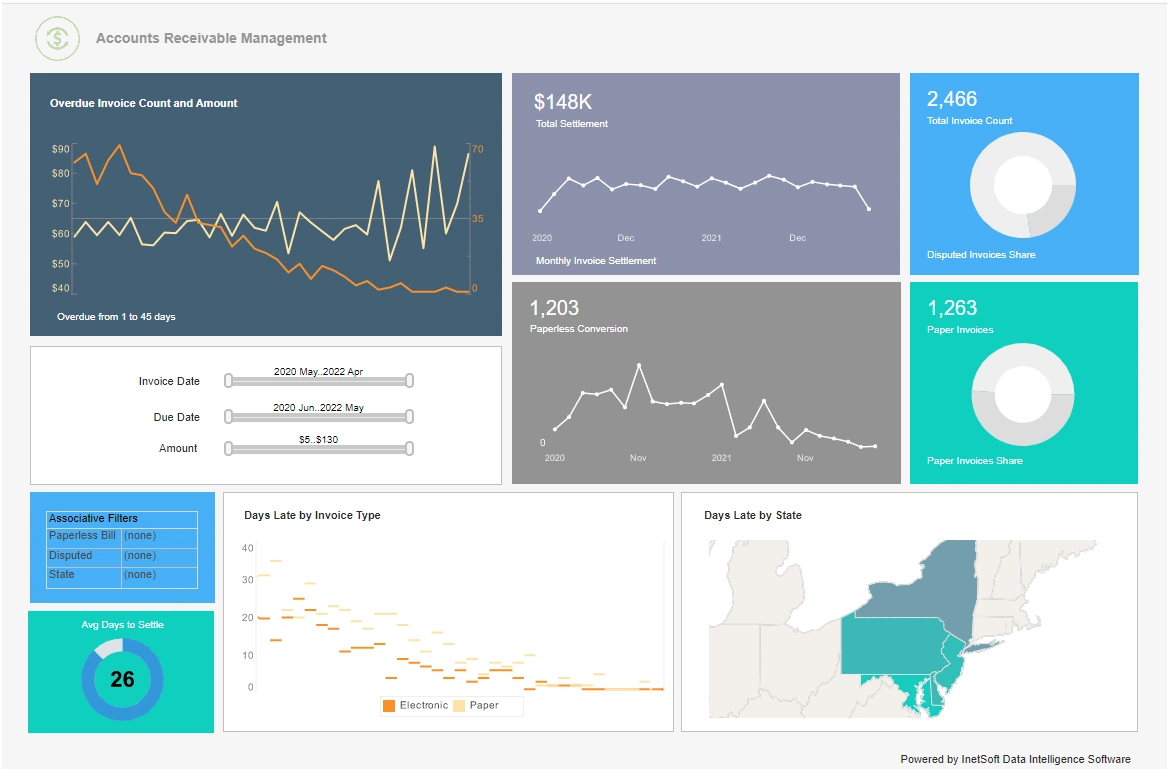
Dashboard Portal
Executives monitor a few important indicators to ensure smooth business strategy execution. A bird's eye's view through a dashboard portal with drilldown capability is the perfect interface.
Spotlight: How Does an Athletic Apparel Company Use a BI Solution?
An athletic apparel company can leverage a Business Intelligence (BI) solution in various ways to enhance its operations, improve decision-making, and drive growth. Here are several ways in which such a company could utilize BI:
-
Sales and Inventory Management: BI tools can integrate sales data from various channels, such as online stores, retail outlets, and wholesalers. By analyzing this data, the company can gain insights into sales trends, identify top-performing products, and forecast demand. This helps in optimizing inventory levels, reducing stockouts, and minimizing excess inventory costs.
-
Customer Segmentation and Targeting: BI solutions can analyze customer data to segment the customer base based on factors such as demographics, purchasing behavior, and preferences. By understanding different customer segments, the company can tailor marketing campaigns and product offerings to specific groups, leading to higher conversion rates and customer satisfaction.
-
Supply Chain Optimization: BI tools can track and analyze data related to the supply chain, including supplier performance, transportation costs, and lead times. By identifying inefficiencies and bottlenecks, the company can optimize its supply chain processes, reduce costs, and improve delivery times.
-
Product Performance Analysis: BI solutions can provide insights into the performance of individual products, including sales volume, profitability, and customer feedback. This information can help the company identify underperforming products that may need to be discontinued or repositioned in the market, as well as identify opportunities for new product development.
-
Marketing Effectiveness: BI tools can analyze marketing campaigns across various channels, such as social media, email, and advertising platforms. By tracking key performance indicators (KPIs) such as customer acquisition cost, return on investment (ROI), and customer engagement, the company can optimize its marketing spend and allocate resources to the most effective channels.
-
Predictive Analytics: BI solutions can use historical data to build predictive models for forecasting future trends, such as sales volumes, consumer preferences, and market demand. By leveraging predictive analytics, the company can make more informed decisions about inventory management, production planning, and marketing strategies.
-
Competitor Analysis: BI tools can gather and analyze data on competitors, including pricing strategies, product offerings, and market share. By monitoring the competitive landscape, the company can identify emerging trends, benchmark its performance against competitors, and identify opportunities for differentiation.
-
Operational Efficiency: BI solutions can track key performance indicators (KPIs) related to operational efficiency, such as production output, labor productivity, and equipment downtime. By identifying areas for improvement, the company can streamline its operations, reduce costs, and increase profitability.