Business Intelligence Dashboards
Are you researching business intelligence dashboard software? Since 1996 InetSoft has been a pioneer in offering innovative BI data solutions.
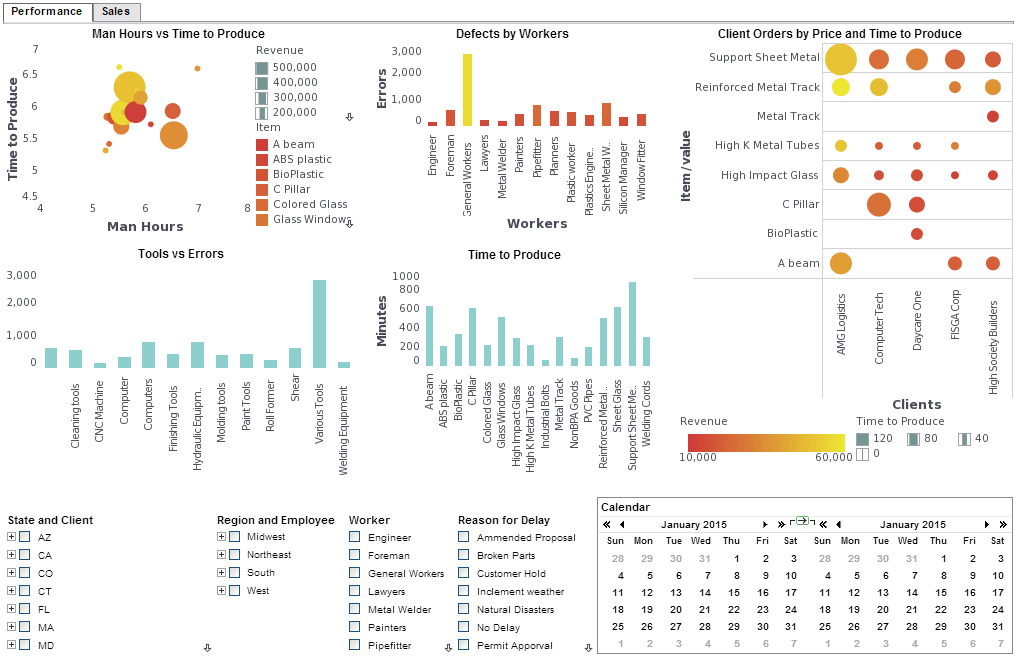
Dashboard visualization and analysis features include:
Rich multi-dimensional charting
Multi-dimensional charting is the ability to depict more than two dimensions on a graph by simultaneously representing points through various shapes, sizes, or colors. This enables users to create 3d, 4d, or even 5d charts.
Brushing for data exploration
Brushing is a technique that allows users to highlight data points within one chart and immediately isolate corresponding data points in accompanying charts leading to quick comparative analysis and recognition of aberrations and outlier.
 |
View a 2-minute demonstration of InetSoft's easy, agile, and robust BI software. |
Co-located multi-charts
The ability to position multiple charts of various types in a shared location and quickly sort through them by clicking on the corresponding tab thereby reducing the complexity of the data visualization dashboard and enhancing the propensity for accurate interpretation.
Custom geographic data binding
The ability to bind data to built-in geographic points on world, state, or city levels, as well as custom defined areas on a map like sales territories or political districts. Geographic mapping in business intelligence (BI) software allows organizations to visualize and analyze spatial data, revealing patterns and trends that are geographically based. This powerful tool enhances decision-making by providing insights into location-specific performance metrics, resource allocation, and market opportunities.
Drag-and-drop dashboard designer
The ability to drag desired elements like charts, tables, filter, or objects onto a design grid and then drop Data Blocks™ onto them. From the design grid, users can manipulate the size, color, font, text, layout, or display of any element they chose.
Multi-source data mashup and visualization
The ability to analyze data with visualizations created from combinations of various data sources including: Relational databases via JDBC, multidimensional databases, OLAP cubes, XML, SOAP, Java beans (POJO), EJB beans, CSV, Microsoft Excel spreadsheet XLS exports, and Web services. Data transformation capabilities can make ETL processes unnecessary.
Case Study: Leveraging Business Intelligence Dashboards at OceanTherm Energy
Ocean Thermal Energy Conversion (OTEC) is an innovative technology that generates electricity by utilizing the temperature difference between warm surface water and cold deep water in the ocean. OceanTherm Energy, a pioneering company in the OTEC sector, faced several challenges in optimizing operations, enhancing performance, and ensuring sustainability. This case study explores how OceanTherm Energy successfully implemented business intelligence (BI) dashboards to address these challenges and improve overall efficiency and decision-making.
Background
OceanTherm Energy specializes in the development, installation, and operation of OTEC systems. The company aims to provide a sustainable and renewable energy source by harnessing the ocean's thermal energy. Despite their technological advancements, OceanTherm Energy encountered several operational issues:
- Data Fragmentation: Data was dispersed across multiple systems, making it difficult to gain comprehensive insights.
- Operational Inefficiencies: Inefficient monitoring and management of energy production and maintenance activities.
- Performance Variability: Variations in energy output due to changing oceanic conditions and system performance.
- Sustainability Monitoring: Challenges in tracking environmental impact and sustainability metrics.
To overcome these issues, OceanTherm Energy decided to implement BI dashboards to centralize data, streamline operations, and enhance decision-making processes.
Implementation
1. Identifying Key Performance Indicators (KPIs): The first step was to identify the critical KPIs necessary for monitoring and improving OTEC operations. Key metrics included:
- Energy Production: Amount of electricity generated daily, weekly, and monthly.
- System Efficiency: Conversion efficiency of the OTEC system.
- Maintenance Metrics: Downtime, maintenance frequency, and repair costs.
- Environmental Impact: Water temperature changes, marine life impact, and carbon footprint.
- Financial Performance: Revenue, operating costs, and return on investment (ROI).
2. Selecting the Right BI Tools: OceanTherm Energy selected a comprehensive BI platform that could integrate with their existing systems, including SCADA (Supervisory Control and Data Acquisition) systems, environmental sensors, and financial software. The chosen platform provided real-time data visualization, advanced analytics, and customizable dashboard features.
3. Data Integration and Centralization: The next step involved integrating data from various sources into the BI platform. This process included linking real-time data feeds from SCADA systems, importing historical performance data, and connecting financial and environmental databases. Centralizing this data allowed for a unified view of operations and performance.
4. Developing Custom Dashboards: Custom dashboards were developed to provide real-time insights into key operational and financial metrics. These dashboards were designed to cater to different user roles within the organization, from engineers and technicians to management and executives. For example, engineers could monitor system efficiency and maintenance needs, while executives could track financial performance and sustainability metrics.
5. Training and Change Management: To ensure successful adoption of the new BI tools, OceanTherm Energy conducted comprehensive training sessions for all relevant staff. Change management initiatives were also implemented to address any resistance and to encourage the use of BI dashboards in daily operations.
Results
1. Improved Operational Efficiency: By centralizing data and providing real-time insights, the BI dashboards enabled better monitoring and management of the OTEC systems. This led to a 20% improvement in overall system efficiency and a reduction in unplanned downtime by 15%.
2. Enhanced Performance Monitoring: The ability to track and analyze energy production and system performance in real-time helped OceanTherm Energy identify performance issues quickly and implement corrective actions. As a result, energy output variability was reduced, and average energy production increased by 10%.
3. Optimized Maintenance Activities: Maintenance metrics provided by the dashboards allowed for predictive maintenance scheduling, reducing unexpected breakdowns and maintenance costs by 25%. This proactive approach also extended the lifespan of critical components.
4. Better Sustainability Tracking: Environmental impact dashboards enabled OceanTherm Energy to monitor and minimize their ecological footprint. The company could track water temperature changes and marine life impact, ensuring compliance with environmental regulations and improving their sustainability initiatives.
5. Informed Decision-Making: The comprehensive insights provided by the BI dashboards empowered executives and managers to make data-driven decisions. Financial dashboards highlighted areas for cost savings and investment opportunities, leading to a 15% increase in ROI.


