Conditional Highlighting in a Report
When a Text element, Textbox element, or Table element is bound to data, highlights can be defined for the element. A Highlight is comprised of a foreground color, a background color, and a font, which are applied to the element when a specific data condition is met.
Highlighting a Text or Textbox Element
To add a highlight to a Text or Textbox element, right-click on the element and choose ‘Highlight’ from the context menu.
The Highlight tab is now available in the bottom panel. Click ‘New’ to add a new highlight. You can assign to the highlight both foreground and background colors, as well as a specific font. Use the ‘Edit Condition’ button to add the conditions that will control highlighting.
You can assign different highlights to the same text, with each highlight representing a different condition. The highlight which is applied to the text will be the highlight whose corresponding condition is met by the current data.
Highlighting Data in a Table
To highlight data in a Table, right-click on the Table element and select ‘Highlight’. The options for a Table are similar to those for a Text element. The one difference in highlighting a Table is that you need to select the column to which the highlight should be applied. Alternatively, the highlight can be applied to an entire table row by clicking in the left margin to select the row. The following example illustrates both approaches.
The existence of a row-based highlight is indicated by an asterisk in the left margin next to the row, as shown below. To edit a row-based highlight, click the asterisk to select the row, and then proceed as shown above.
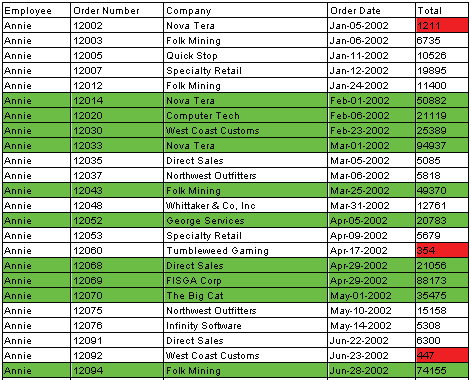
In this example, we will highlight the cells containing Totals of under 5000 using a red background, and highlight the entire rows containing Totals above 20,000 using a green background. To add these cell and row highlights, follow the steps below:
- Open the Designer and click the ‘New’ button. In the ‘Create Report’ dialog box select ‘Blank Tabular Report’ and click ‘OK’.
- Click the ‘Table Wizard’ button to open the ‘Data Binding’ dialog box for a new table.
- Under the Data tab, bind the table to the ‘All Sales’ query from the ‘Orders’ data source, and click ‘Finish’. Add the red highlights for low totals (under 5000):
- Select the body cell under the ‘Total’ header. Right-click and select ‘Highlight.’ The Highlight tab is now available in the bottom panel.
- Click ‘New’ to add a new highlight, and name it “Poor Performance”.
- Select a red color for the ‘Background’ in the ‘Properties’ pane.
- Click the ‘Edit Condition’ button, and append the following condition: [Total] [is] [less than] [5000]
- Next, add the green row-based highlights for high totals (over 20,000):
- Select the body row of the table by clicking next to it in the left margin. You will see an arrow indicating that the row is now selected.
- Right-click anywhere in the selected row and select ‘Highlight.’ The Highlight tab is now available in the bottom panel.
- Click ‘New’ to add a new highlight, and name it ‘Good Performance’.
- Select a green color for the ‘Background’ in the ‘Properties’ panel.
- Click the ‘Edit Condition’ button, and append the following condition: [Total] [is] [greater than] [20000]
- Preview the table and observe the cell and row highlighting.
| Previous: Hyperlink Tool Tips in a Report |
Next: Report Bursting
|

