InetSoft Product Documentation: Grouping and Summarization
Grouping in a table or section causes rows with the same value for a selected field to be positioned consecutively. Summarization adds a row containing the summary of a selected field to the end of the table or section. Summarization may be performed for each of the defined groups, as well as for the dataset as a whole.
When you have added a grouping field, you can set the sort order as ascending, descending, or original order. For a date-time field, you can group by day, month, year, etc. Named Groups can be used to create a coarser grouping in which multiple field values are placed into a single group. Predefined Named Groups, created in a Data Worksheet, can also be used. See Creating a Named Grouping in the Data Worksheet Guide for more information.
The ‘Top N’ sub-pane is used to narrow down the data set to display only a specified number of groups from a grouping column when the data is sorted by the values in one of the summary columns. ‘Top N’ will display the highest groups, ‘Bottom N’ will display the lowest groups, and ‘Sort All’ sorts all of the groups without selecting a certain number.
You can treat multiple columns as a single group (composite grouping). To do this, Ctrl-click to multi-select the desired columns in the column list, and add them to the group column list together. This creates a composite grouping where each unique combination of column values defines a unique group.


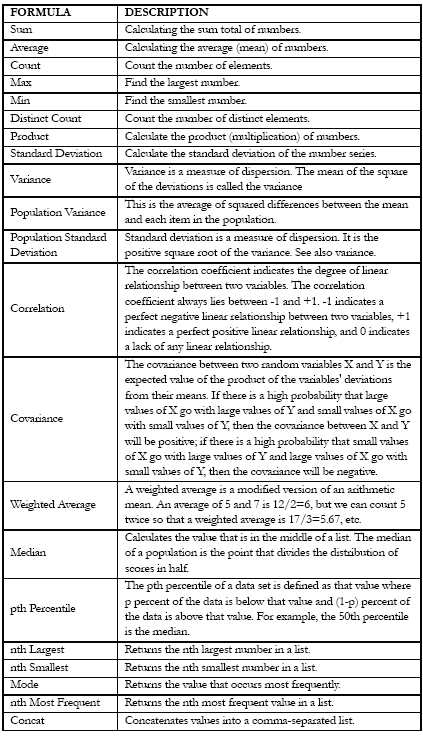
Summarization Formulas
There is a large selection of standard summarization formulas available for the summary field.
Walkthrough: Grouping and Summary in Data Binding
This example is continued from the previous chapter, Adding Conditions to Data Binding.
1. Click ‘Next>>’ or select the Grouping & Summary tab.
2. Select ‘Customer.Company’ from the list of columns and click on the right-arrow to make this the first grouping column. For this example, follow the steps and add each group separately. If you Ctrl-click multiple columns in the ‘Available Columns’ panel and add them to the ‘Grouping’ panel simultaneously, you will create a composite grouping rather than the desired nested grouping.
3. Repeat the above to add ‘Product.Name’ below ‘Customer.Company’.
4. Move ‘TotalDiscount’ into the summary window.
5. Select ‘Product.Name’ in the ‘Grouping’ pane and click the Top N tab.
6. Select ‘Top’ from the drop-down list, enter “3” for the number of groups, and select ‘Sum(TotalDiscount)’ from the second list.
7. Click ‘Finish’ to complete the data binding.
8. Click ‘Preview’ in the Report Designer toolbar. When prompted, enter “10” for the ‘minimum order size’ filter parameter.
Notice how the data now displays only records with quantities greater than or equal to 10, and where the customer company was either Computer Tech or Eastern Data. Additionally, the data only displays records for the top three products based on summarized total.
