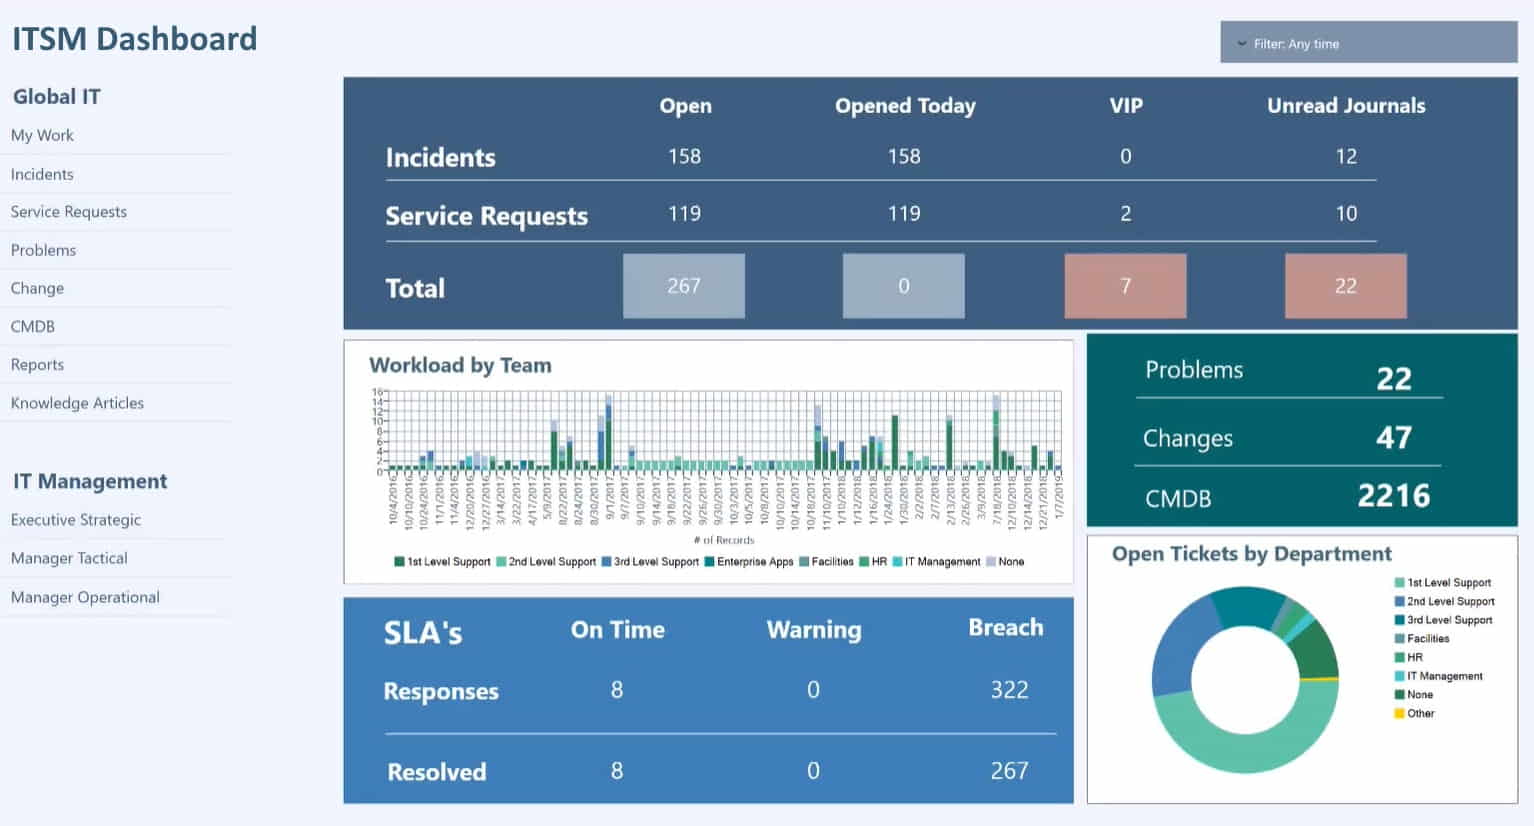
Key Metrics for IT Managers
Below is the continuation of the transcript from a Webcast video from InetSoft Technology. The speaker is Mark Flaherty, CMO at InetSoft.
Flaherty: In these cubes, you can do things such as get one for performance counters or state information. And once you have got your information in the cubes, then it’s really quite easy to light up the rest of the data for the BI application to see.
So what we have done is shown you how to then in Style Intelligence, connect through to these cubes to build out dashboards, scorecards and the analytic components so that you can do things such as locate your data and trend it.
You can pull information together from multiple instances of the systems center, which a lot of IT pros like to be able to do to do. They want to be able to get a holistic view of their entire systems and pull that information together in a sandbox environment as well as do some root cause analysis to understand whether some of your metrics might be tracking off.
We have also written a whitepaper that shows you how to do some of the trickier bits. We have packaged up some samples as well. We have packaged up integration services and ETL packages which extract information right from your systems center data warehouse and then create the BI data warehouse. We have packaged up the cubes and we have packaged up some of these sample dashboards as well to kind of really accelerate things and get you going if you want to layer this business intelligence on top of systems center.
Bord: So when you wrote this whitepaper and you kind of helped build these packages, you helped determine obviously the information that you want to pull out that’s best for the IT pro. Where did that come from when you said okay this is the kind of stuff an IT pro really needs to pay attention to in order to stay on top of their systems? Is that a combination of customer information, stuff that came up internally in InetSoft. Where did that all come from?
Flaherty: Yes, so this was really the brain child of a number of different people. A lot of it is customer based so the key metrics that a lot of the IT managers that we talked to wanted to track for their IT department. Plus the systems center team has an incredible amount of history and expertise as both IT pros, as IT managers. They have helped define a system that can help those processes. Also our BI product developers have layered in how we could actually visualize that data to bring the most value out of the data that we are collecting through the systems center.
What Are Some Key Metrics IT Managers Use?
IT managers rely on a variety of key metrics to assess the performance, efficiency, and effectiveness of their IT operations. These metrics provide valuable insights into how well IT resources are utilized, the quality of services delivered, and the overall health of the IT infrastructure. Here are some key metrics commonly used by IT managers:
- Uptime and Availability:
- Metric: Percentage of time systems are operational.
- Importance: High availability is critical for business continuity. Downtime can lead to lost productivity and revenue.
- Incident and Problem Resolution:
- Metric: Mean Time to Repair (MTTR), Mean Time Between Failures (MTBF).
- Importance: Measures the efficiency of the IT team in identifying and resolving issues, minimizing disruptions.
- Service Desk Performance:
- Metric: First Call Resolution (FCR), Average Speed to Answer (ASA).
- Importance: Reflects the effectiveness of the support team in addressing user issues promptly and resolving them in the first interaction.
- Capacity Utilization:
- Metric: Server, storage, and network utilization rates.
- Importance: Ensures that IT resources are neither underutilized nor overburdened, optimizing cost and performance.
- Response and Load Times:
- Metric: Website response time, application load time.
- Importance: User experience is influenced by how quickly IT services respond. Slow response times can lead to dissatisfaction and decreased productivity.
- Security Metrics:
- Metric: Number of security incidents, time to detect and respond to security threats.
- Importance: Reflects the effectiveness of the organization's cybersecurity measures in protecting sensitive data and systems.
- Backup and Recovery Metrics:
- Metric: Backup success rate, recovery time objective (RTO), recovery point objective (RPO).
- Importance: Ensures data integrity and the ability to recover quickly in the event of data loss or system failures.
- Cost Management:
- Metric: IT spending as a percentage of revenue, cost per user.
- Importance: Monitors and optimizes IT expenditures, ensuring alignment with business goals and cost-effectiveness.
- Change Management Metrics:
- Metric: Change success rate, time to implement changes.
- Importance: Evaluates the efficiency and reliability of the change management process.
- User Satisfaction:
- Metric: User surveys, feedback ratings.
- Importance: Gauges user perception of IT services and helps identify areas for improvement.
- Innovation Metrics:
- Metric: Number of implemented innovations, time to market for new technologies.
- Importance: Assesses the organization's ability to adopt and leverage emerging technologies for business advantage.


