InetSoft Makes Coronavirus Tracker Mashup Available
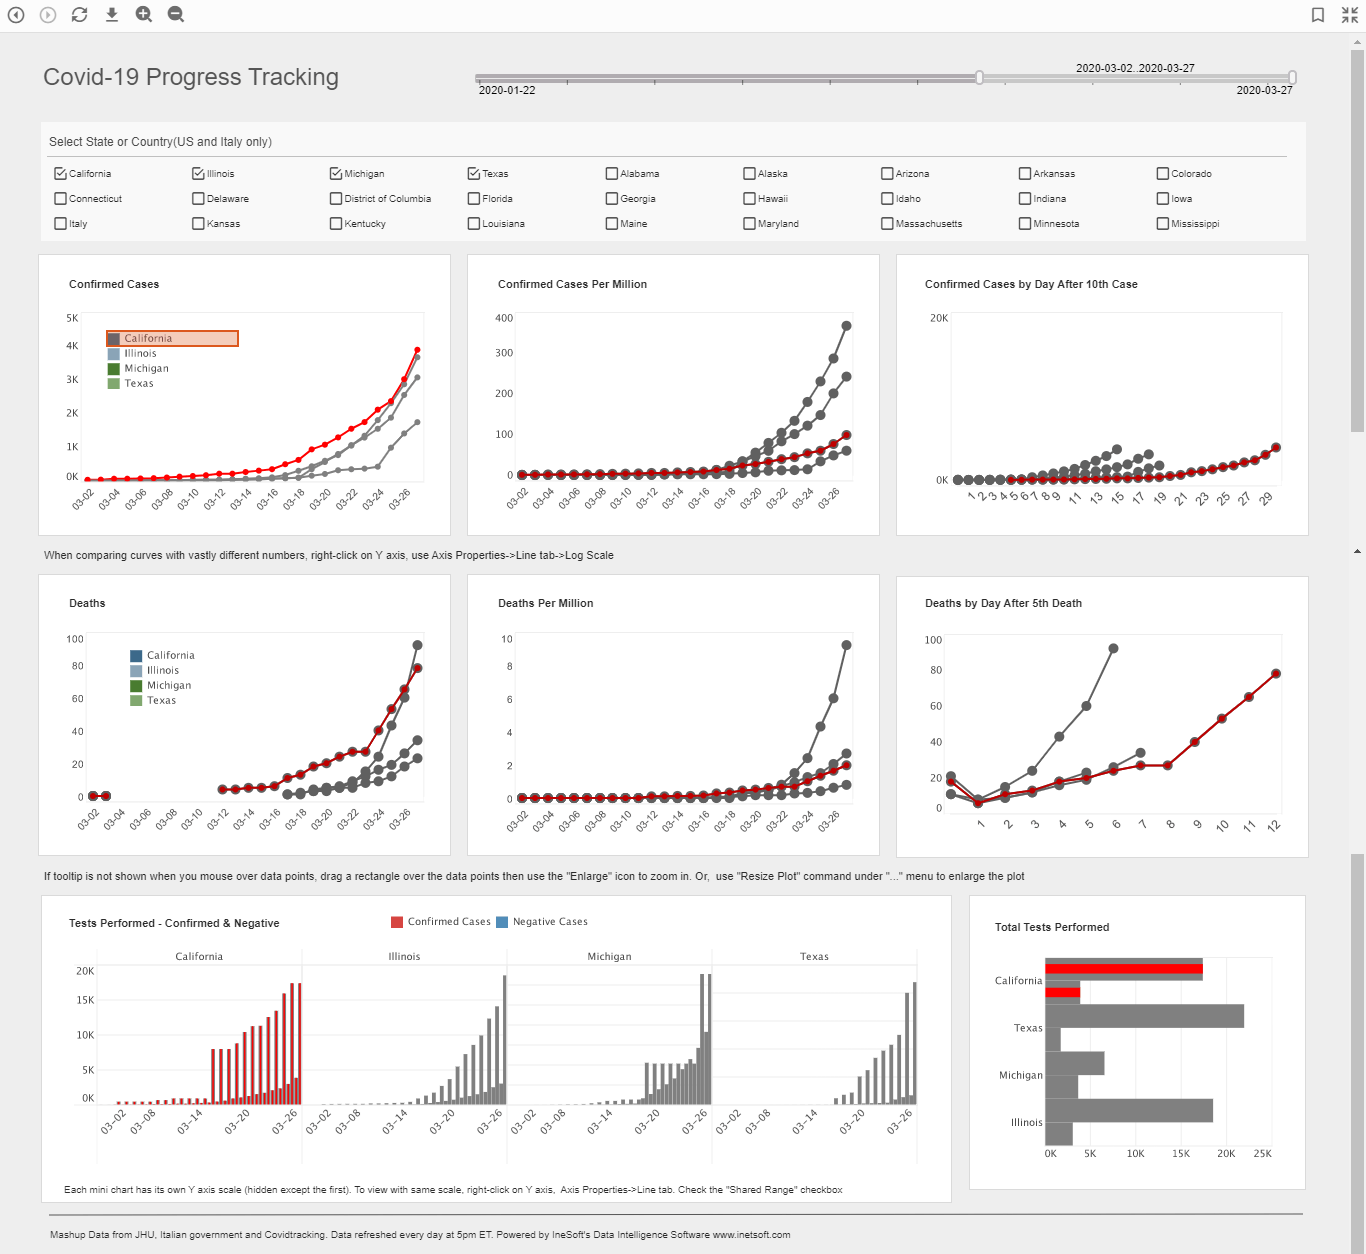
March 30, 2020 - Piscataway NJ - InetSoft Technology, a pioneer in data intelligence, analytics, and dashboarding, has released a live COVID-19 tracking dashboard which mashes up test performance data and infection rate data, for a detailed analysis of live case data from the United States and Italy. Many other dashboards show simple geographic mapping of positive case data, but none bring together daily test results to better understand the rate of spread.
The interactive analytical dashboard mashes up live data from Johns Hopkins University, covidtracking.com, and the Italian Department of Civil Protection. Italy's data is included since it is the western location that is chronologically in the forefront of fighting the curve. It provides a benchmark of comparison and a way to detect changes in the curve slopes there and in each state, all of which are following varying timelines of inception. Features of the data visualization include:
- Comparisons among states and with Italy for all metrics
- Per capita case and death rates and curves
- Infection and death curves lining up number of days since milestone occurrence
- Testing data comparing positives and negatives
- Eight charts in one view, all expandable
"Everyone is doing their part to flatten the curve, and everyone is eager to understand how the battle is progressing. We noticed that the other dashboards already available were missing key parts of the story, namely testing counts and better per capita comparisons. Now, we think this dashboard will make it easier to notices changes in the slopes of each curve and see the light at the end of the tunnel," offered Mark Flaherty, Chief Marketing Officer at InetSoft.
To interact with the live novel coronavirus tracking dashboard, please visit:
https://www.inetsoft.com/info/us_covid_test_tracker_dashboard/
About InetSoft
Since 1996, InetSoft has been delivering easy, agile, and robust business intelligence software that makes it possible for organizations and solution providers of all sizes to deploy or embed full-featured business intelligence solutions. Application highlights include visually-compelling and interactive dashboards that ensure greater end-user adoption, plus pixel-perfect report generation, scheduling, and bursting. InetSoft's patent pending Data Block technology enables productive reuse of queries and a unique capability for end-user defined data mashup. This capability, combined with efficient information access enabled by InetSoft's visual analysis technologies, allows a maximum degree of self-service that benefits the average business user, the IT administrator, and the developer. InetSoft solutions have been deployed at over 5,000 organizations worldwide, including 25% of Fortune 500 companies, spanning all types of industries.
Contact
For more information, media and analysts may contact:
Mark Flaherty
InetSoft Technology Corp.
+1.732.424.0400 x 936
mark.flaherty@inetsoft.com
www.inetsoft.com
Quotable
“Everyone is doing their part to flatten the curve, and everyone is eager to understand how the battle is progressing...”
Visualization Views
![]()
